The Treasury bids and offers the Dow Jones Industrial Average
- DJIA trades near 53,400, up more than 160 points but still 2.4% beneath the record.
- The Treasury's 950 billion Dollar cash account is available for bond buying.
- Sanctions conference at 18:00 GMT, Hormuz traffic near a fifth of prewar.

The same department that spent the morning telling the bond market it has roughly 950 billion Dollars available to hold long yields down will spend the afternoon announcing sanctions designed to tighten the oil chokepoint that drove those yields up. The Dow Jones Industrial Average trades near 53,400 on the first half of that arrangement, up more than 160 points and 0.3%, while the S&P 500 and the Nasdaq Composite both sit lower.
The account that changes the arithmetic
On August 19 the Treasury doubled the ceiling on its long-end buyback operations to at least 4 billion Dollars a pass, and the long end rallied and then handed most of it back inside the session. The fade was arithmetic rather than scepticism. Four billion Dollars at a time, against a 20-to-30-year sector that has run a buyers' strike since late June, is not a bid but a gesture.
Two senior officials have now attached a number to it. The Treasury General Account (TGA), the government's operating balance at the Federal Reserve, is considered available to fund the purchases, and it stands near 950 billion Dollars. That is some 350 billion Dollars above the working level the account was run at under the previous administration, and every Dollar leaving it arrives in the banking system as reserves.
A bill for every bond
Repurchasing a thirty-year bond does not retire debt. It swaps one government liability for another, and the money comes from selling short-dated paper, which shortens the average maturity of the borrowing. The Treasury Secretary has called the operation a twist, which is the honest name for it.
The consequence arrives Friday. The more of the debt that floats at the front of the curve, the more of the federal interest bill floats with the policy rate, so a department that has just made itself a large buyer of duration now holds a direct financial stake in what the Fed Chair says in Wyoming. Interest expense has already run past 1.1 trillion Dollars this fiscal year, against a July shortfall of 432.3 billion Dollars.
The afternoon half
At 18:00 GMT the Treasury Secretary unveils what the administration has trailed as the largest financial offensive ever mounted against Iran, with a weekend opinion piece promising an economic reckoning and a warning pointed at the countries still lifting Iranian barrels. Tehran's national security chief has answered that any state joining the measures commits an act of war.
The mechanism that reaches an equity index is the barrel. Traffic through the Strait of Hormuz runs near a fifth of its prewar average, Tehran is threatening to fine, seize or confiscate vessels that break its transit rules, and American pump prices sit roughly a Dollar a gallon above last year. Measures that succeed in cutting Iranian export revenue tighten the same physical market that has kept the long end selling all summer.
What the index actually did
Underneath the announcements the session was a semiconductor rout. The benchmark chip fund fell close to 3%, Micron Technology (MU) shed more than 5%, and Advanced Micro Devices (AMD) and Broadcom (AVGO) both gave ground, with optical and storage names following them down. None of it reaches this average, because the only chip name inside the thirty is Nvidia (NVDA).
That membership fact is the entire distance between an index up more than 160 points and two others that are lower, which makes the session useless as a read on the economy, though the shape of it says something. The high printed just short of 53,500 inside the first quarter hour after the New York open and the low near 53,100 came in the late London morning, leaving a tape parked in front of an 18:00 GMT headline.
The week the calendar catches up
Wednesday at 12:30 GMT brings the July Personal Consumption Expenditures (PCE) price index, with the core measure seen at 0.2% MoM from 0.1% and the annual rate holding at 3.3%. Preliminary second-quarter Gross Domestic Product (GDP) figures land in the same block and the consensus looks for no revision at all, 1.5% annualised with the price index at 6.3%. Nvidia reports from inside the index that evening.
Friday is the collision worth marking. The Fed Chair speaks at 14:00 GMT from the annual symposium, and in the same minute the Bureau of Labor Statistics (BLS) publishes the preliminary benchmark revision to the payroll survey, the annual reconciliation of a sample against employer tax records. The 2024 preliminary estimate took 818K jobs off the count, and this one lands on a labour market that has already contracted once.
Levels
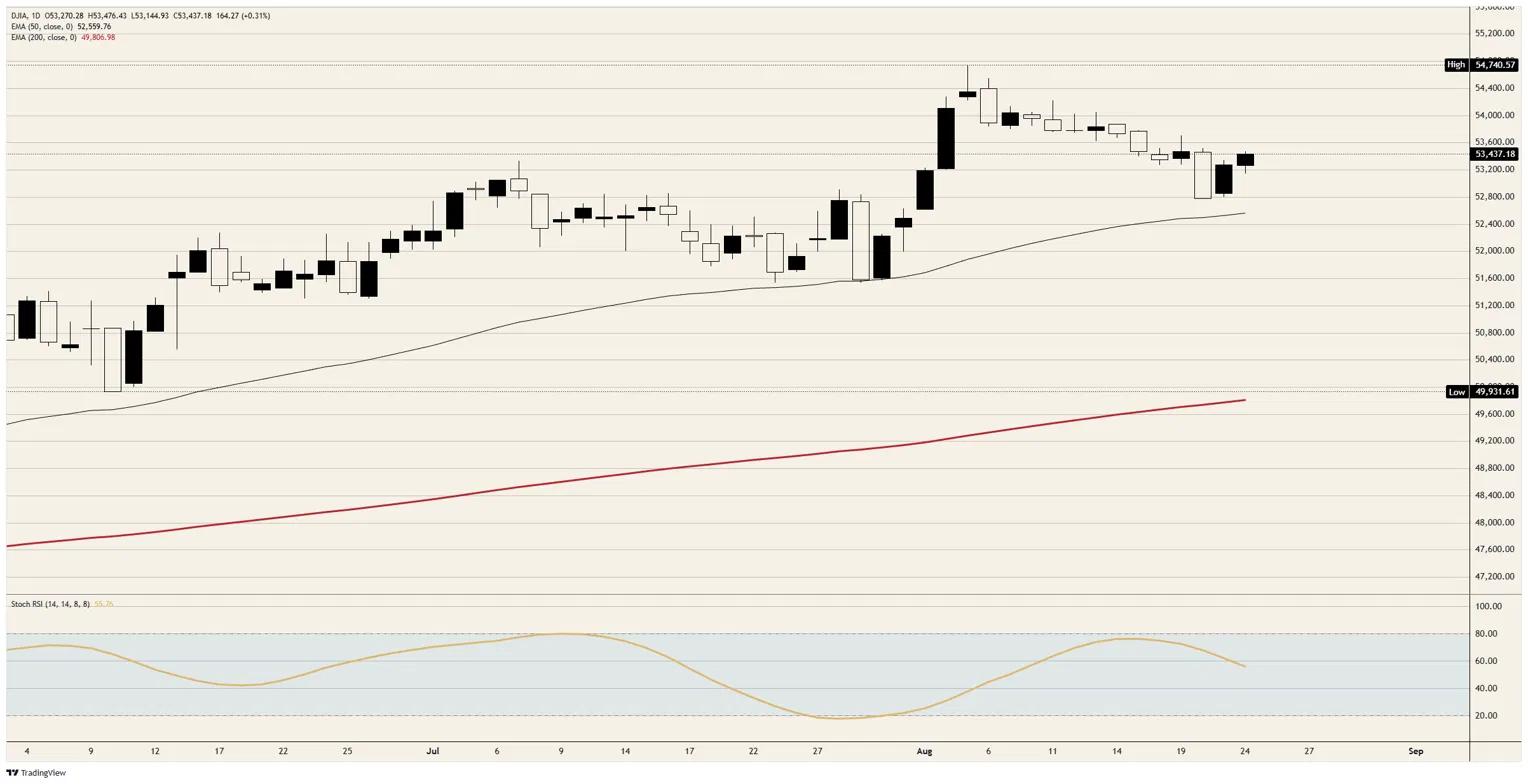
Resistance: Just short of 53,500 carried the session high and is the first line, with the 53,800 area the cap that has turned back every attempt since the middle of the month. Above it sit the 54,100 ledge and the record just short of 54,750.
Support: The 53,100 area held the session low, with the 53,000 handle beneath it and a rising 50-day Exponential Moving Average (EMA) near 52,600 under that. The daily Stochastic Relative Strength Index (Stoch RSI) sits mid-range near 55 and pointing lower.
Bias: Bearish while the 53,800 area caps. Objectives the 53,100 area, then the 53,000 handle. Invalidation on a daily close above 53,800.
Dow Jones daily chart
Dow Jones FAQs
The Dow Jones Industrial Average, one of the oldest stock market indices in the world, is compiled of the 30 most traded stocks in the US. The index is price-weighted rather than weighted by capitalization. It is calculated by summing the prices of the constituent stocks and dividing them by a factor, currently 0.152. The index was founded by Charles Dow, who also founded the Wall Street Journal. In later years it has been criticized for not being broadly representative enough because it only tracks 30 conglomerates, unlike broader indices such as the S&P 500.
Many different factors drive the Dow Jones Industrial Average (DJIA). The aggregate performance of the component companies revealed in quarterly company earnings reports is the main one. US and global macroeconomic data also contributes as it impacts on investor sentiment. The level of interest rates, set by the Federal Reserve (Fed), also influences the DJIA as it affects the cost of credit, on which many corporations are heavily reliant. Therefore, inflation can be a major driver as well as other metrics which impact the Fed decisions.
Dow Theory is a method for identifying the primary trend of the stock market developed by Charles Dow. A key step is to compare the direction of the Dow Jones Industrial Average (DJIA) and the Dow Jones Transportation Average (DJTA) and only follow trends where both are moving in the same direction. Volume is a confirmatory criteria. The theory uses elements of peak and trough analysis. Dow’s theory posits three trend phases: accumulation, when smart money starts buying or selling; public participation, when the wider public joins in; and distribution, when the smart money exits.
There are a number of ways to trade the DJIA. One is to use ETFs which allow investors to trade the DJIA as a single security, rather than having to buy shares in all 30 constituent companies. A leading example is the SPDR Dow Jones Industrial Average ETF (DIA). DJIA futures contracts enable traders to speculate on the future value of the index and Options provide the right, but not the obligation, to buy or sell the index at a predetermined price in the future. Mutual funds enable investors to buy a share of a diversified portfolio of DJIA stocks thus providing exposure to the overall index.
Author

Joshua Gibson
FXStreet
Joshua joins the FXStreet team as an Economics and Finance double major from Vancouver Island University with twelve years' experience as an independent trader focusing on technical analysis.