Silver Price Forecast: XAG/USD slides as US CPI tops estimates
- Silver slips as stronger-than-expected US inflation lifts the US Dollar and Treasury yields.
- Hawkish Fed comments strengthen expectations of further interest rate hikes.
- XAG/USD trades below its 21-day, 100-day and 200-day SMAs, keeping the bearish outlook intact.
Silver (XAG/USD) comes under heavy selling pressure on Tuesday as stronger-than-expected US inflation lifts the US Dollar (USD) and pushes US Treasury yields higher. At the time of writing, XAG/USD trades around $51.23, down 3.97% on the day.
The US Consumer Price Index (CPI) rose 0.4% MoM in October, above the 0.3% forecast but below September's 0.6% increase. Core CPI, which excludes food and energy, increased 0.3%, matching September's pace and exceeding the 0.2% expected.
Adding to the pressure, Dallas Fed President Lorie Logan said the Federal Reserve (Fed) needs “at least two more 25-basis-point (bps) rate increases” and that it “may be possible to move more rapidly this winter.” Before the release, Fed Governor Christopher Waller said a half-point rate hike may be needed in December if October core CPI comes in “around 0.3% or higher.”
According to the CME FedWatch Tool, traders now see an 89.2% chance of a 25-bps rate hike in December and a 10.8% probability of a larger 50-bps increase. Expectations of further Fed tightening remain a headwind for Silver, as higher interest rates raise the opportunity cost of holding non-yielding assets. Rising US Treasury yields and a stronger Greenback also make the precious metal less attractive to investors.
Technical analysis
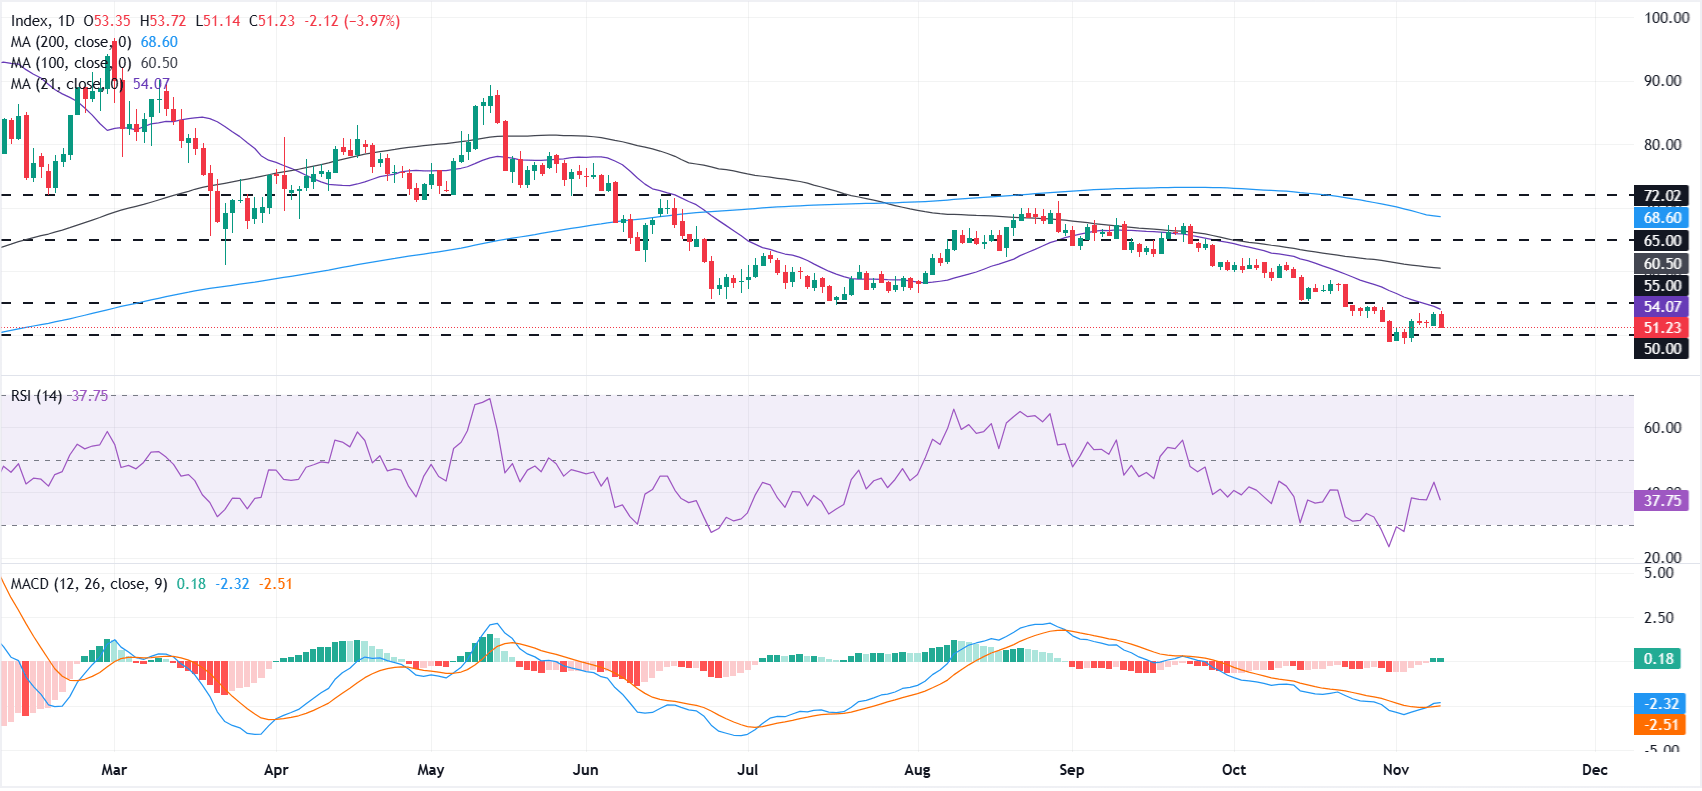
On the daily chart, XAG/USD remains under a clear bearish bias as price holds below the 21-day, 100-day and 200-day simple moving averages (SMAs). The Relative Strength Index (RSI) near 38 keeps a weak tone, while the Moving Average Convergence Divergence (MACD) has turned marginally positive, hinting at a modest attempt to stabilize rather than a confirmed bullish reversal.
On the downside, immediate support is seen at the horizontal level near $50, followed by the year-to-date low of $48.62. A break below this level could open the door for deeper losses.
On the topside, initial resistance is aligned at the 21-day SMA around $54, followed by a horizontal barrier at $55. Beyond that, the 100-day SMA at $60.50 and the higher horizontal level at $65 precede the longer-term 200-day SMA near $68.60, which together define a broad overhead supply zone that would need to be reclaimed to ease the prevailing bearish pressure.
(The technical analysis of this story was written with the help of an AI tool. Know more.)
US Dollar Price Today
The table below shows the percentage change of US Dollar (USD) against listed major currencies today. US Dollar was the strongest against the Australian Dollar.
| USD | EUR | GBP | JPY | CAD | AUD | NZD | CHF | |
|---|---|---|---|---|---|---|---|---|
| USD | 0.64% | 0.87% | 0.57% | 0.54% | 1.16% | 0.79% | 0.86% | |
| EUR | -0.64% | 0.22% | -0.05% | -0.09% | 0.51% | 0.15% | 0.22% | |
| GBP | -0.87% | -0.22% | -0.30% | -0.31% | 0.29% | -0.08% | -0.00% | |
| JPY | -0.57% | 0.05% | 0.30% | -0.04% | 0.57% | 0.20% | 0.28% | |
| CAD | -0.54% | 0.09% | 0.31% | 0.04% | 0.61% | 0.24% | 0.31% | |
| AUD | -1.16% | -0.51% | -0.29% | -0.57% | -0.61% | -0.37% | -0.29% | |
| NZD | -0.79% | -0.15% | 0.08% | -0.20% | -0.24% | 0.37% | 0.08% | |
| CHF | -0.86% | -0.22% | 0.00% | -0.28% | -0.31% | 0.29% | -0.08% |
The heat map shows percentage changes of major currencies against each other. The base currency is picked from the left column, while the quote currency is picked from the top row. For example, if you pick the US Dollar from the left column and move along the horizontal line to the Japanese Yen, the percentage change displayed in the box will represent USD (base)/JPY (quote).
Author

Vishal Chaturvedi
FXStreet
I am a macro-focused research analyst with over four years of experience covering forex and commodities market. I enjoy breaking down complex economic trends and turning them into clear, actionable insights that help traders stay ahead of the curve.