NZD/USD Price Forecast: Hits eight-week highs above 0.5950 as risk appetite returns
- NZD/USD rallies by more than 1% on Wednesday, hitting an eight-week high above 0.5950.
- Comments by US officials hinting at the end of Iran's war have boosted risk appetite.
- New Zealand Dollar bulls are aiming for the 0.5965 area.

The New Zealand Dollar (NZD) is rallying sharply against the US Dollar (USD) on Wednesday, as comments from US officials suggesting the war with Iran might be nearing its end have boosted investors’ appetite for risk. The risk-sensitive Kiwi has appreciated more than 1% so far today, hitting a fresh eight-week high of 0.5953 from Tuesday's lows of 0.5856.
US President Donald Trump boosted market sentiment earlier on Wednesday when he announced a pause in the plan to escort vessels through the Strait of Hormuz, citing advances in the peace negotiations with Iran. Previously, US Secretary of State Marco Rubio affirmed that the objectives of the Iran war had been achieved, suggesting that the US is not interested in resuming hostilities.
Technical Analysis: The next bullish target is 0.5965
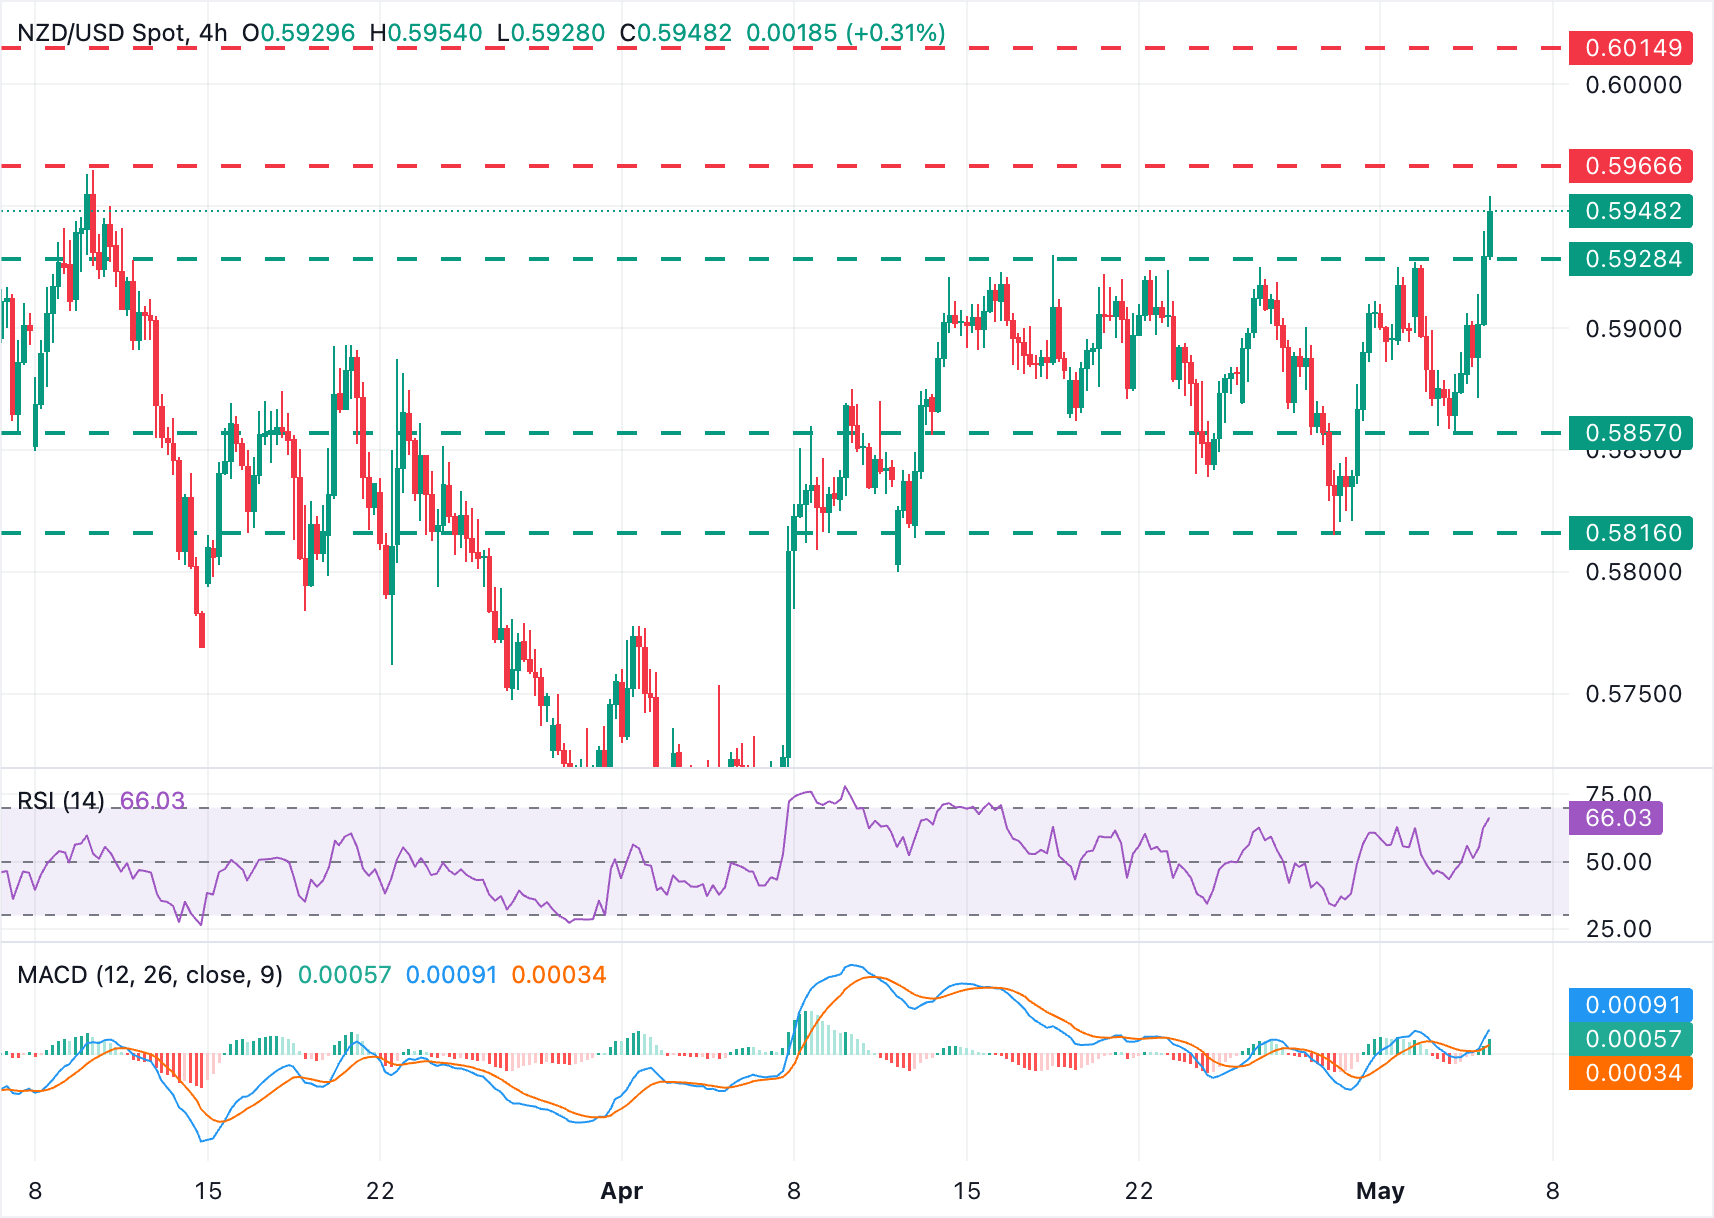
NZD/USD is heading north after breaking a key resistance area around 0.5930, which has been holding upside attempts since mid-April.
Technical indicators on the 4-hour chart are positive. The 14-period Relative Strength Index (RSI) nears overbought territory, but is not yet there, while the Moving Average Convergence Divergence (MACD) line remains in slightly positive territory, together suggesting that there is room for further appreciation.
Bulls are aiming for the March 10 high at 0.5965, where they might find some resistance. Further up, the area between the March 1 high around the 0.6000 round level and the February 26 high, near 0.6015, will come into focus. On the downside, the mentioned resistance at 0.5930 is likely to act as support on a potential bearish reversal. Below here, the next bearish target would be Tuesday's low, around 0.5855.
(The technical analysis of this story was written with the help of an AI tool.)
US Dollar Price Today
The table below shows the percentage change of US Dollar (USD) against listed major currencies today. US Dollar was the strongest against the Canadian Dollar.
| USD | EUR | GBP | JPY | CAD | AUD | NZD | CHF | |
|---|---|---|---|---|---|---|---|---|
| USD | -0.33% | -0.33% | -0.98% | -0.21% | -0.86% | -1.02% | -0.34% | |
| EUR | 0.33% | -0.01% | -0.64% | 0.14% | -0.52% | -0.71% | -0.00% | |
| GBP | 0.33% | 0.00% | -0.64% | 0.15% | -0.51% | -0.71% | 0.02% | |
| JPY | 0.98% | 0.64% | 0.64% | 0.77% | 0.11% | -0.07% | 0.68% | |
| CAD | 0.21% | -0.14% | -0.15% | -0.77% | -0.65% | -0.83% | -0.12% | |
| AUD | 0.86% | 0.52% | 0.51% | -0.11% | 0.65% | -0.17% | 0.54% | |
| NZD | 1.02% | 0.71% | 0.71% | 0.07% | 0.83% | 0.17% | 0.71% | |
| CHF | 0.34% | 0.00% | -0.02% | -0.68% | 0.12% | -0.54% | -0.71% |
The heat map shows percentage changes of major currencies against each other. The base currency is picked from the left column, while the quote currency is picked from the top row. For example, if you pick the US Dollar from the left column and move along the horizontal line to the Japanese Yen, the percentage change displayed in the box will represent USD (base)/JPY (quote).
Author

Guillermo Alcala
FXStreet
Graduated in Communication Sciences at the Universidad del Pais Vasco and Universiteit van Amsterdam, Guillermo has been working as financial news editor and copywriter in diverse Forex-related firms, like FXStreet and Kantox.