|

IONQ Elliott Wave technical analysis [Video]

IONQ Elliott Wave analysis

Function: Counter Trend.

Mode: Corrective.

Structure: Corrective.

Position: Wave A of y.

Direction: Downside in Wave C

Details: Price targeting $25 and then $20 as Wave C nears completion.

In the daily timeframe, IonQ, Inc. (IONQ) is advancing through the final stages of its corrective structure. Wave C, within Wave y, is leading the price toward the $25 level, and potentially to $20. This movement suggests the conclusion of a larger corrective phase may be near. As Wave B finishes, a decline in Wave C is likely to follow, setting up a possible short-term bearish opportunity.
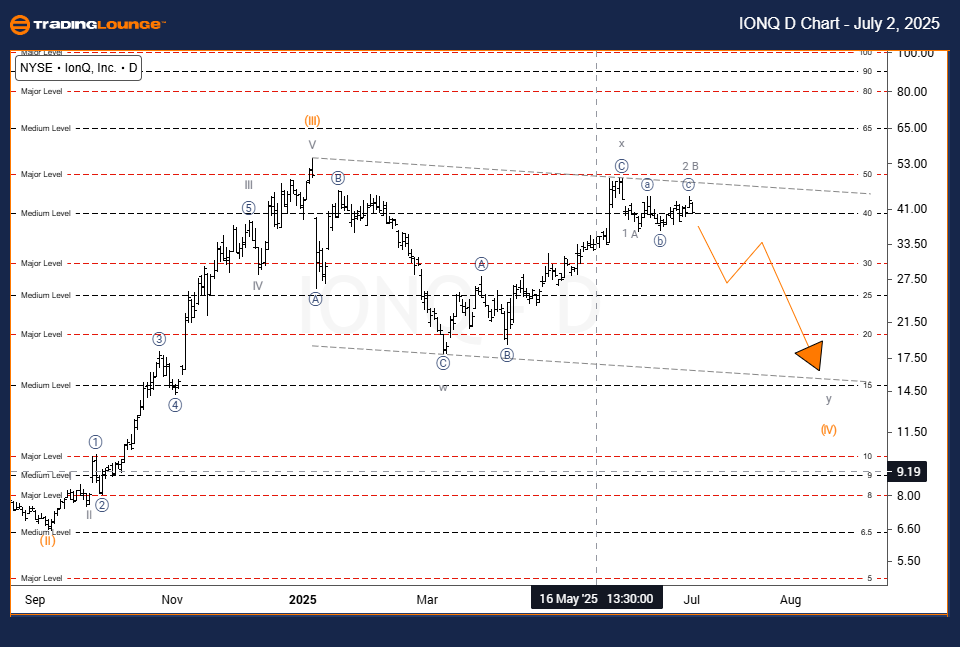
Chart

IONQ Elliott Wave analysis

Function: Counter Trend.

Mode: Corrective.

Structure: Corrective.

Positino: Wave y of (IV).

Direction: Downside into Wave y.

Details: Wave y has reached 100% of Wave w’s length, indicating maturity.

The weekly chart for IonQ shows a mature corrective structure forming as Wave y of Wave (IV) nears completion. The stock has achieved a price extension equaling 100% of Wave w, a common threshold signaling a possible end to the correction. While the overarching trend remains bullish, this area could mark a short-term bottom. Traders should monitor price behavior for potential support and signs of a new impulse move.
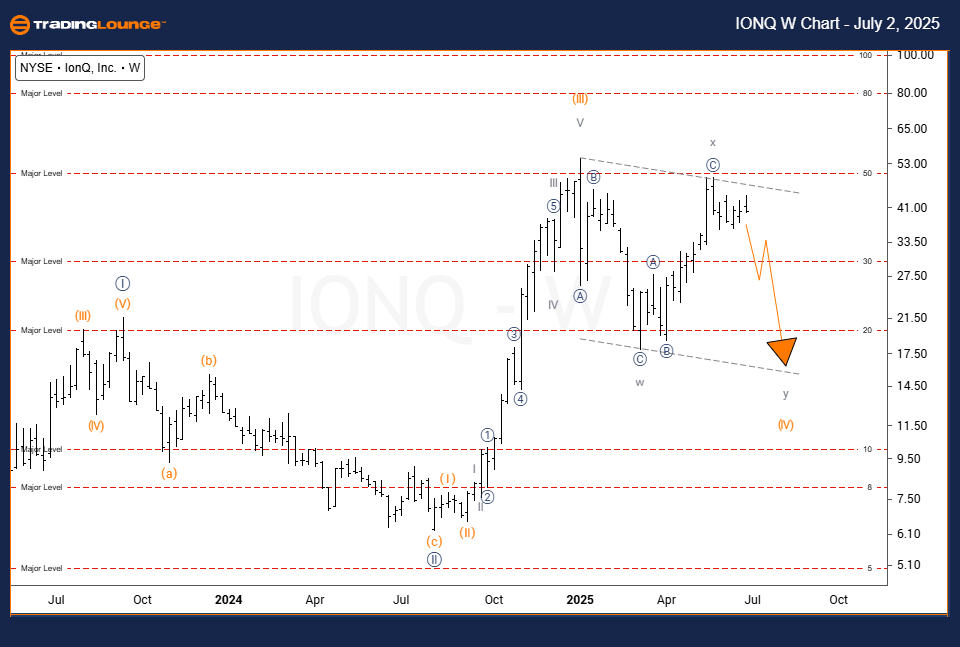
Chart

IONQ Elliott Wave analysis [Video]

Author

Peter Mathers

Peter Mathers

TradingLounge

Peter Mathers started actively trading in 1982. He began his career at Hoei and Shoin, a Japanese futures trading company.


More from Peter Mathers
Share:

Editor's Picks

GBP/USD defends 1.3300 after strong UK PMI data

Following Thursday's sharp decline, GBP/USD clings to small gains above 1.3300 in the American session on Friday, supported by the upbeat UK Retail Sales and July PMI data. Nevertheless, the pair's upside remains capped as investors cling to a cautious stance amid a further escalation of tensions in the Middle East. The US July PMI data failed to trigger relevant price action.

EUR/USD remains below 1.1400 after mixed US PMIs

EUR/USD pressures daily lows below the 1.1400 mark in the American session on Friday. Mixed S&P Global PMIs, as manufacturing output contracted while services activity expanded in July, triggered no relevant market reaction. The focus remains in Middle East developments and inflation-related concerns.

Gold holds above $4,050 but momentum still missing

Gold builds on its modest intraday bounce and climbs above the $4,050 level on Friday, hitting a fresh daily high amid a modest US Dollar pullback. The fundamental backdrop, however, warrants some caution before confirming that the pullback from an over two-week high, touched on Wednesday, has run its course and positioning for any meaningful upside.

Ethereum: Derivatives interest in ETH improves, but signs of caution remain

Ethereum is hovering slightly below the $1,900 level, down 3% on Thursday following a slight expansion in derivatives interest. The top altcoin's open interest has increased to 14.60 million ETH, marking a 600K ETH increase over the past two days and its highest level since June 7.

XRP retreats as ETF interest cools
Ripple (XRP) slides toward the short-term $1.10 support on Friday, as broader crypto market sentiment weighs on crypto assets. The sell-off mainly stems from fears of inflation in the United States (US) amid the ongoing war in the Middle East and rising Oil prices.
US Dollar mid-year outlook: Exceptional currency, exceptional risks?
The US Dollar enters the second half of 2026 in a markedly different position from a year ago. The King currency has recovered, reflecting persistent US inflation, changing expectations for Fed policy, geopolitical tensions and renewed demand for defensive assets.