- GBP/USD bulls are fighting the bearish odds, re-attempting the upside.
- UK political jitters, mixed Retail Sales data could remain a drag on cable.
- Cable bulls struggle to yield a break above the key 1.2275 hurdle.
GBP/USD is moving back and forth in a 40-pips narrow range so far this Friday, now attempting another bounce towards 1.2300.
The renewed upside in the major is fuelled by a bout of weakness seen in the US dollar across its main peers, as risk sentiment receives a fresh boost. Easing rate hike expectations from the ECB and BOE amid increasing recession risks is helping calm the market nerves.
Bulls, however, could face a hard time extending the latest uptick, as the UK political jitters remain in play. A senior Tory party member resigned after the ruling Conservative Party lost two crucial seats in the parliamentary by-elections on Friday. The latest news put PM Johnson’s leadership in jeopardy, which could undermine the sterling’s upswing.
Further, the UK Retail Sales for May came in mixed, earlier on, with the previous figures revised downwards. The discouraging fundamentals point to the BOE’s dilemma of fighting inflation while balancing the economic growth. UK Retail Sales drop 0.5% MoM in May vs. -0.7% expected
Attention now turns towards the two-tier data from the US for fresh trading impetus, as risk sentiment is likely to lead the way into the weekly close.
Looking at cable’s four-hour chart, the latest uptick in the price has taken out the falling trendline resistance at 1.2275. Should bulls manage to hold above the latter on a four-hourly candlestick closing basis, a test of the bearish 100-Simple Moving Average (SMA) at 1.2336 will be inevitable.
Ahead of that, the 1.2300 round figure will offer stiff resistance to GBP buyers. The Relative Strength Index (RSI) is pointing higher above the midline, allowing room for more upside.
GBP/USD: Four-hour chart
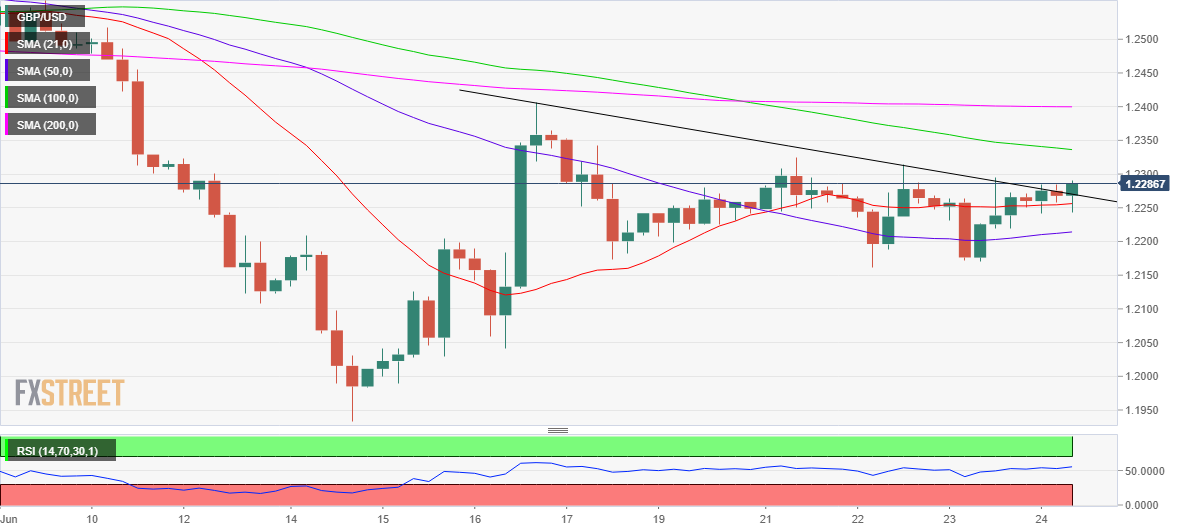
On the flip side, the immediate support is now seen at the 21 SMA at 1.2256, below which a sharp drop towards the mildly bullish 50 SMA at 1.2214 will be in the offing.
The next stop for sellers will be seen at the 1.2200 demand area on increased downside pressure.
GBP/USD: Additional technical levels
Information on these pages contains forward-looking statements that involve risks and uncertainties. Markets and instruments profiled on this page are for informational purposes only and should not in any way come across as a recommendation to buy or sell in these assets. You should do your own thorough research before making any investment decisions. FXStreet does not in any way guarantee that this information is free from mistakes, errors, or material misstatements. It also does not guarantee that this information is of a timely nature. Investing in Open Markets involves a great deal of risk, including the loss of all or a portion of your investment, as well as emotional distress. All risks, losses and costs associated with investing, including total loss of principal, are your responsibility. The views and opinions expressed in this article are those of the authors and do not necessarily reflect the official policy or position of FXStreet nor its advertisers. The author will not be held responsible for information that is found at the end of links posted on this page.
If not otherwise explicitly mentioned in the body of the article, at the time of writing, the author has no position in any stock mentioned in this article and no business relationship with any company mentioned. The author has not received compensation for writing this article, other than from FXStreet.
FXStreet and the author do not provide personalized recommendations. The author makes no representations as to the accuracy, completeness, or suitability of this information. FXStreet and the author will not be liable for any errors, omissions or any losses, injuries or damages arising from this information and its display or use. Errors and omissions excepted.
The author and FXStreet are not registered investment advisors and nothing in this article is intended to be investment advice.
Recommended content
Editors’ Picks
EUR/USD clings to gains near 1.0700, awaits key US data

EUR/USD clings to gains near the 1.0700 level in early Europe on Thursday. Renewed US Dollar weakness offsets the risk-off market environment, supporting the pair ahead of the key US GDP and PCE inflation data.
USD/JPY keeps pushing higher, eyes 156.00 ahead of US GDP data

USD/JPY keeps breaking into its highest chart territory since June of 1990 early Thursday, recapturing 155.50 for the first time in 34 years as the Japanese Yen remains vulnerable, despite looming intervention risks. The focus shifts to Thursday's US GDP report and the BoJ decision on Friday.
Gold closes below key $2,318 support, US GDP holds the key

Gold price is breathing a sigh of relief early Thursday after testing offers near $2,315 once again. Broad risk-aversion seems to be helping Gold find a floor, as traders refrain from placing any fresh directional bets on the bright metal ahead of the preliminary reading of the US first-quarter GDP due later on Thursday.
Injective price weakness persists despite over 5.9 million INJ tokens burned
Injective price is trading with a bearish bias, stuck in the lower section of the market range. The bearish outlook abounds despite the network's deflationary efforts to pump the price.
Meta takes a guidance slide amidst the battle between yields and earnings

Meta's disappointing outlook cast doubt on whether the market's enthusiasm for artificial intelligence. Investors now brace for significant macroeconomic challenges ahead, particularly with the release of first-quarter GDP data.