GBP/JPY Price Forecast: Trendline breakout puts 213.00 in sight
- GBP/JPY rallies for the third consecutive day after breaking the descending trendline.
- Buyers target 211.28 and the 50-day SMA at 211.57 next.
- A break above 212.00 exposes the 200-day SMA at 213.00 and 213.50.

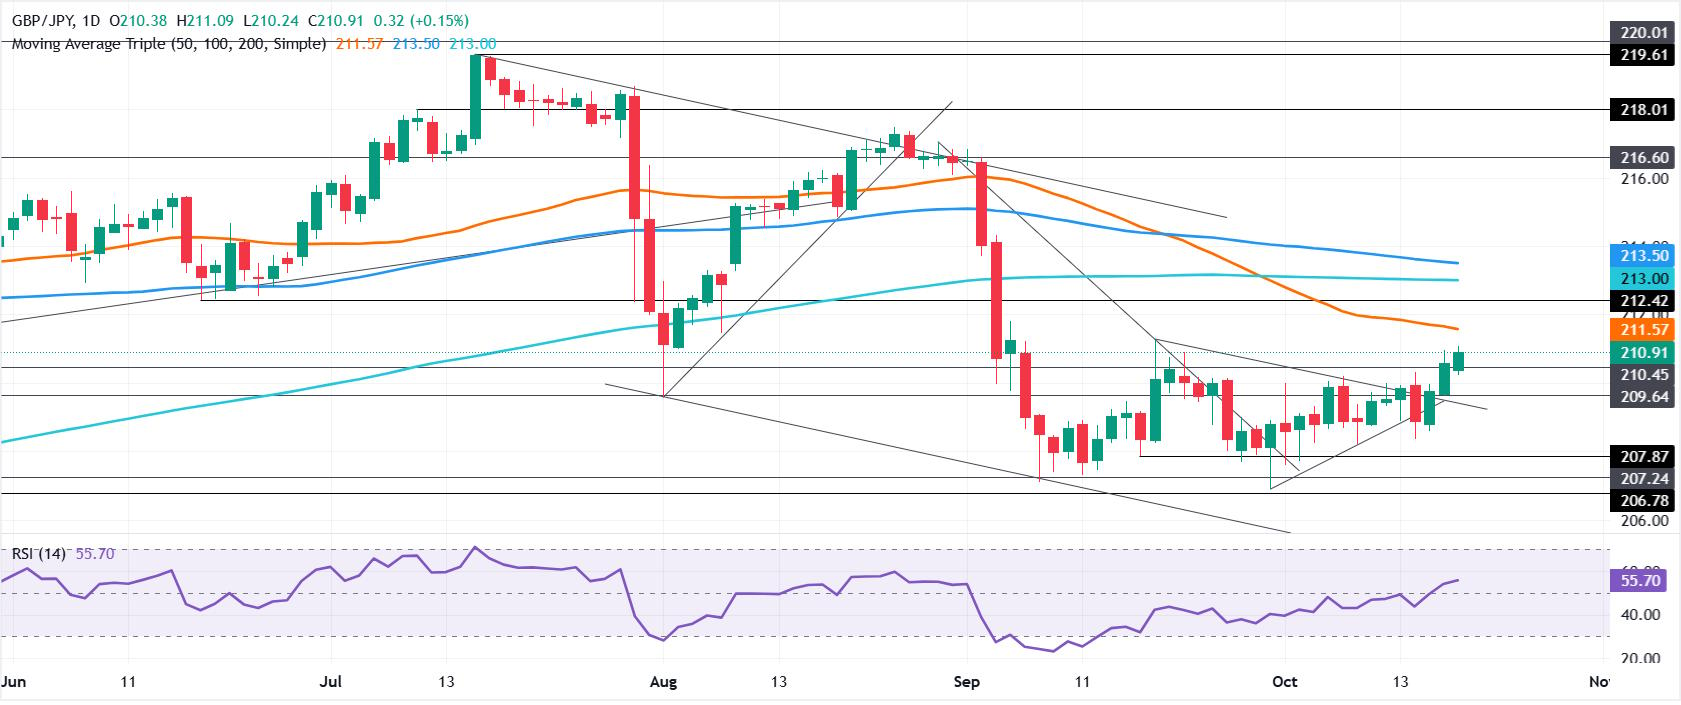
GBP/JPY advances about 0.16% at the time of writing on Monday and extends its rally for the third straight day, with the cross pair trading at 210.93 as it approaches the September 18 high of 211.28, the next key resistance ahead of the 50-day Simple Moving Average (SMA).
GBP/JPY Price Forecast: Technical outlook
Although the cross-pair seems to be gaining traction, a break of key resistance levels is needed for GBP/JPY buyers to retest mid-July or August levels in the 217.40-219.50 area before US and Japanese authorities intervene in the FX markets.
After clearing a downslope resistance trendline drawn from the September 18 high, GBP/JPY rallied 140 pips, exposing the 211.00 figure as the next area of interest. If buyers reclaim it, a move to the 50-day SMA at 211.57 is on the cards. This could put into play a test of the 212.00 mark, ahead of the 200-day SMA at 213.00, followed by the 100-day SMA at 213.50.
A bearish scenario resumes if GBP/JPY tumbles back below a downward resistance trendline, near 209.30. Beneath this area emerges the October 8 swing low of 208.20, followed by the September 30 cycle low of 206.89.
GBP/JPY Price Chart – Daily
Japanese Yen Price Today
The table below shows the percentage change of Japanese Yen (JPY) against listed major currencies today. Japanese Yen was the strongest against the Swiss Franc.
| USD | EUR | GBP | JPY | CAD | AUD | NZD | CHF | |
|---|---|---|---|---|---|---|---|---|
| USD | 0.24% | 0.19% | 0.33% | -0.21% | -0.48% | -0.16% | 0.32% | |
| EUR | -0.24% | -0.06% | 0.11% | -0.45% | -0.72% | -0.42% | 0.08% | |
| GBP | -0.19% | 0.06% | 0.15% | -0.39% | -0.68% | -0.35% | 0.13% | |
| JPY | -0.33% | -0.11% | -0.15% | -0.52% | -0.89% | -0.48% | 0.01% | |
| CAD | 0.21% | 0.45% | 0.39% | 0.52% | -0.26% | 0.04% | 0.54% | |
| AUD | 0.48% | 0.72% | 0.68% | 0.89% | 0.26% | 0.32% | 0.83% | |
| NZD | 0.16% | 0.42% | 0.35% | 0.48% | -0.04% | -0.32% | 0.49% | |
| CHF | -0.32% | -0.08% | -0.13% | -0.01% | -0.54% | -0.83% | -0.49% |
The heat map shows percentage changes of major currencies against each other. The base currency is picked from the left column, while the quote currency is picked from the top row. For example, if you pick the Japanese Yen from the left column and move along the horizontal line to the US Dollar, the percentage change displayed in the box will represent JPY (base)/USD (quote).
Author

Christian Borjon Valencia
FXStreet
Markets analyst, news editor, and trading instructor with over 14 years of experience across FX, commodities, US equity indices, and global macro markets.