- The euro recovered some ground vs. the Japanese yen amidst the scenario of Japanese authorities intervening in the FX markets.
- EUR/JPY Price Analysis: The formation of a bearish flag pattern in the 1-hour chart would open the door for further losses.
The EUR/JPY is snaping three days of consecutive losses, courtesy of last Friday’s verbal intervention by Japanese authorities, which spurred a dip from YTD highs at around 144.18 to 139.38, almost a 500 pip fall. However, on Tuesday, the EUR/JPY is recovering and erases 150 pips of losses, gaining 1.06%, and is trading at 141.06, as the New York session winds down.
Sentiment remains negative. Expectations that the US Federal Reserve would hike 75 bps mounted. Banks in Wall Street updated their Fed calls on Tuesday after an article by the WSJ that stated that due to high inflationary indicators, the US central bank would “surprisingly” hike 75 bps.
The aforementioned triggered a bloodbath in global equities, which remain on the defensive. US Treasury yields remain elevated, and the greenback rose.
The EUR/JPY got a boost, despite a dismal than expected EU data. As expected, inflation in Germany rose by 7.9% YoY in May, alongside other inflationary numbers that came in line as estimated. However, the Zew Economic Sentiment Index in the Euro area and Germany missed expectations. Nevertheless, it was ignored by traders.
EUR/JPY Price Analysis: Technical outlook
The EUR/JPY’s daily chart depicts the cross-currency as upward biased, but the RSI, albeit in the bullish territory, is trendless. That said, the EUR/JPY might consolidate in the near term in the 139.40-141.00 area.
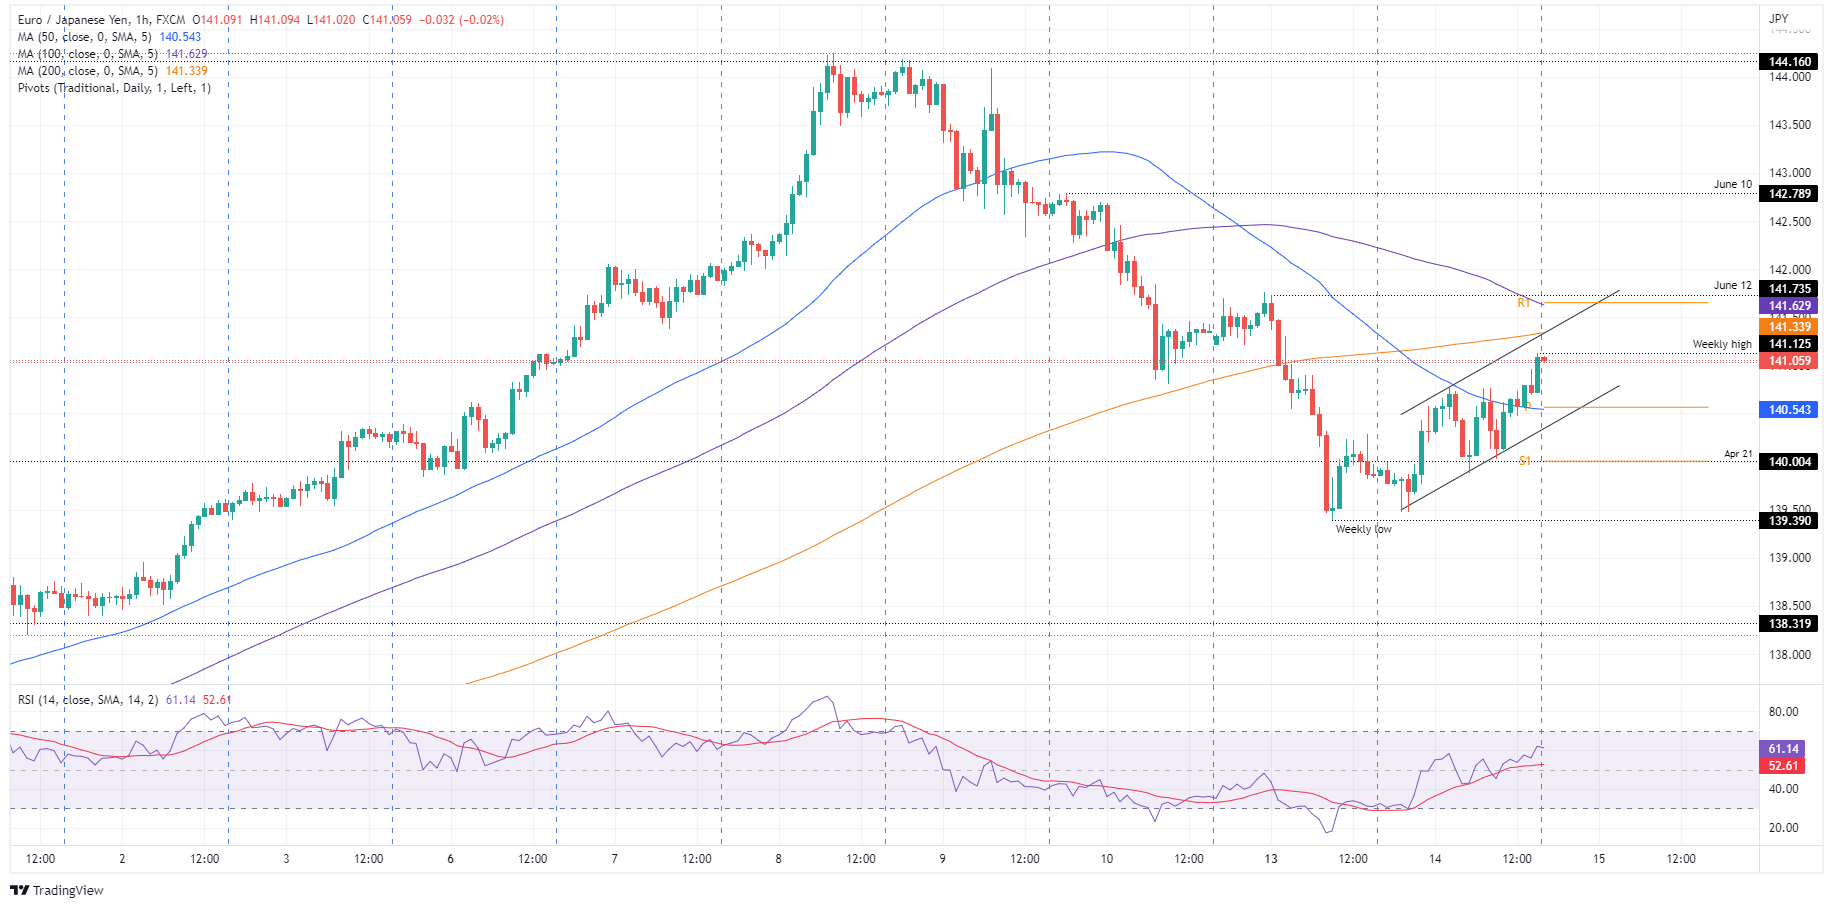
The EUR/JPY’s 1-hour chart illustrates that the pair is confined to an uptrend channel, forming a bearish flag. Nevertheless, a break above the bearish flag-top trendline, which confluences with the 200-hour simple moving average (SMA) at 141.34, would open the door for a test of June’s 12 high, which confluences with the 100-hour SMA and the R1 daily pivot point around 141.76. If that scenario is completed, the following resistance would be June’s 10 high at 142.79.
However, the EUR/JPY path of least resistance is downwards. The EUR/JPY’s first support would be the confluence of the 50-hour SMA and the daily pivot at around 140.54. Break below would expose the bottom trendline of the bearish flag around 140.30-40, followed by the S1 daily pivot at 140.00.
Key Technical Levels
Information on these pages contains forward-looking statements that involve risks and uncertainties. Markets and instruments profiled on this page are for informational purposes only and should not in any way come across as a recommendation to buy or sell in these assets. You should do your own thorough research before making any investment decisions. FXStreet does not in any way guarantee that this information is free from mistakes, errors, or material misstatements. It also does not guarantee that this information is of a timely nature. Investing in Open Markets involves a great deal of risk, including the loss of all or a portion of your investment, as well as emotional distress. All risks, losses and costs associated with investing, including total loss of principal, are your responsibility. The views and opinions expressed in this article are those of the authors and do not necessarily reflect the official policy or position of FXStreet nor its advertisers. The author will not be held responsible for information that is found at the end of links posted on this page.
If not otherwise explicitly mentioned in the body of the article, at the time of writing, the author has no position in any stock mentioned in this article and no business relationship with any company mentioned. The author has not received compensation for writing this article, other than from FXStreet.
FXStreet and the author do not provide personalized recommendations. The author makes no representations as to the accuracy, completeness, or suitability of this information. FXStreet and the author will not be liable for any errors, omissions or any losses, injuries or damages arising from this information and its display or use. Errors and omissions excepted.
The author and FXStreet are not registered investment advisors and nothing in this article is intended to be investment advice.
Recommended content
Editors’ Picks
AUD/USD could extend the recovery to 0.6500 and above

The enhanced risk appetite and the weakening of the Greenback enabled AUD/USD to build on the promising start to the week and trade closer to the key barrier at 0.6500 the figure ahead of key inflation figures in Australia.
EUR/USD now refocuses on the 200-day SMA

EUR/USD extended its positive momentum and rose above the 1.0700 yardstick, driven by the intense PMI-led retracement in the US Dollar as well as a prevailing risk-friendly environment in the FX universe.
Gold struggles around $2,325 despite broad US Dollar’s weakness

Gold reversed its direction and rose to the $2,320 area, erasing a large portion of its daily losses in the process. The benchmark 10-year US Treasury bond yield stays in the red below 4.6% following the weak US PMI data and supports XAU/USD.
Bitcoin price makes run for previous cycle highs as Morgan Stanley pushes BTC ETF exposure

Bitcoin (BTC) price strength continues to grow, three days after the fourth halving. Optimism continues to abound in the market as Bitcoiners envision a reclamation of previous cycle highs.
US versus the Eurozone: Inflation divergence causes monetary desynchronization

Historically there is a very close correlation between changes in US Treasury yields and German Bund yields. This is relevant at the current juncture, considering that the recent hawkish twist in the tone of the Federal Reserve might continue to push US long-term interest rates higher and put upward pressure on bond yields in the Eurozone.