Dow Jones Industrial Average round-trips between Ottawa and the Treasury
- DJIA trades just beneath 53,500 after a round trip of more than 300 points.
- Canada matches rate for rate on more than 700 US goods from September 8.
- The Treasury may fund long-bond buybacks from a 950 billion Dollar cash pile.

The Dow Jones Industrial Average has built a 300-point advance and handed every point of it back inside a single vertical break, and it trades just beneath 53,500 for a gain of roughly a tenth of a percent. The session range runs better than 320 points against a net of 67. Two policy shocks arrived from opposite directions and the index declined to choose between them.
One side carried a second session of falling Treasury yields and a chip bid running ahead of Wednesday evening's results from Nvidia (NVDA), the only semiconductor name in the average. The other carried a confidence miss, a housing print that worsens the further into it you read, and Ottawa's answer to the weekend's tariffs. The first was bought into the session high and the second sold back out of it.
A consumer already out of room
Consumer confidence for August moved to 89.4, down 0.8 points and short of a 90.2 consensus, with the damage sitting in expectations rather than in the reading of present conditions. Households are not calling today worse. They are calling the next six months worse, which is the half of the survey that changes spending rather than reports it.
The housing figures underneath are the harder number. New home sales fell 10.5% MoM in July after a 7.6% decline in June, close to 17% of the monthly run rate gone in two months, while the June Housing Price Index came in flat against a 0.2% consensus and a 0.3% prior. Volumes collapsing while prices stall is a demand problem rather than a supply one.
The tape said the same thing through its worst performer. Dick's Sporting Goods (DKS) is running more than 27% lower and on pace for its weakest session on record, and it is not a member. Walmart (WMT) is, and it is down about 1%.
The bill acquires a second author
Canada answered on Tuesday morning, matching the duties Washington imposed over the weekend rate for rate. The countermeasures run at 15%, 25% and 50% across more than 700 American goods worth roughly 27.6 billion Dollars, take effect September 8, and arrive with a 7.5 billion Dollar package for the Canadian businesses on the receiving end.
Where the list lands matters more than what it totals. Steel and aluminum double to 50%, with dairy, seafood, appliances, agricultural equipment, pulp and paper and electronics behind them. Caterpillar (CAT) is among the heaviest price weights in the average and its best performer of the year, and farm and construction machinery is precisely the category Ottawa selected.
Washington's weekend round put 50% on roughly 28 billion Dollars of Canadian goods, lumber and cement included, an input cost arriving at Home Depot (HD) and a new-build market in its second month of contraction. Both schedules are dated, both sit eight days ahead of the September 16 meeting, and neither appears in a July price index.
The bid came from the wrong building
The advance the index gave back had a source, and it was not the Federal Reserve. Treasury officials indicated on Monday that the department's General Account, a cash balance near 950 billion Dollars and projected to peak above 1 trillion Dollars in late October, is available to fund the expanded long-bond repurchases announced last week. Yields fell for a second session on that, the ten-year note down near 4.66%.
The market had assumed those buybacks would be paid for by selling short-dated bills, which retires duration at the long end and reissues it at the front without adding a Dollar of net cash. Drawing the General Account down is a different operation. Money already collected and parked at the central bank goes out in exchange for long-dated paper, retiring duration and adding reserves at once.
That is the shape of an easing, run by the borrower rather than the central bank, three weeks before a committee still arguing over whether financial conditions are tight enough to reach 2%. The chair has credited higher market yields with doing part of the committee's work, and the fiscal authority spent Monday undoing a piece of it. Nobody voting on September 16 gets a say in the size.
What the calendar actually carries
July personal income and spending lands Wednesday at 12:30 GMT, with core Personal Consumption Expenditures (PCE) prices expected at 0.2% MoM against a 0.1% prior and 3.3% YoY unchanged. The second look at second-quarter Gross Domestic Product (GDP) shares the block at 1.5% annualised. Personal spending is forecast at 0.2% from 0.3%, which after Tuesday's confidence and housing figures is the line on the page.
Jackson Hole opens Thursday and the keynote follows Friday at 14:00 GMT, the last scheduled chance to move September pricing before the vote. Hike odds for September 16 have fallen to roughly a third from close to 60% after the July meeting. Sharing that block and getting none of the attention is the preliminary benchmark revision to nonfarm payrolls, which restates the level of employment while the room watches Wyoming.
Levels and bias
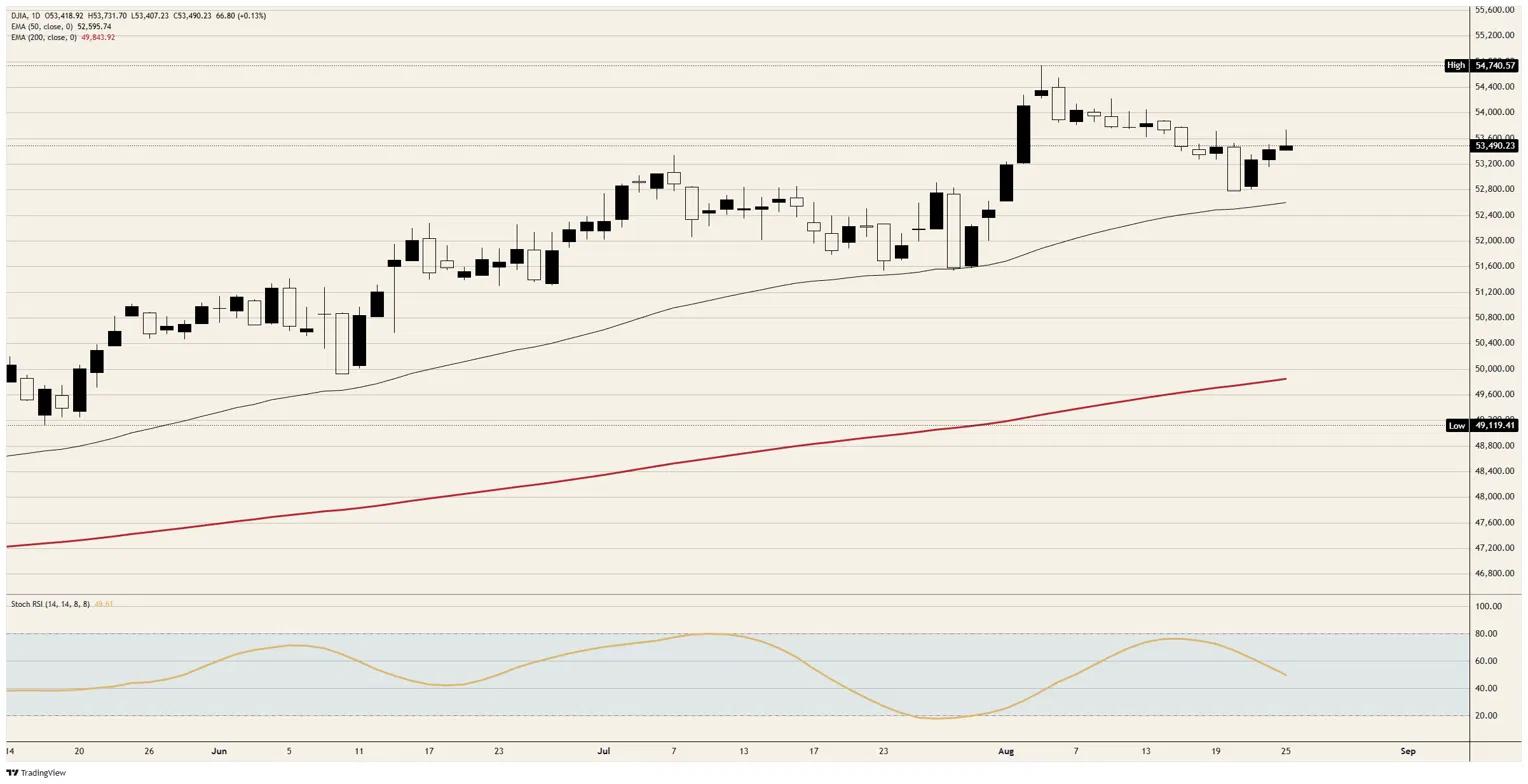
Resistance: The 53,800 area has capped every attempt since mid-August and sits roughly 300 points above spot, with the session high just above 53,700 the immediate line. Through it, 54,100 is the early-August ledge and the record just short of 54,750 stands above that.
Support: The 53,400 area holds the session low, the session open and the prior close together. Beneath it the 53,000 handle is the first real shelf, then the 50-day Exponential Moving Average (EMA) near 52,600, which contained last week's flush without a daily close beneath it.
Bias: Bearish while the 53,800 area caps. The rebound off last week's low has run roughly 750 points and has carried the index straight back into the ceiling that has held since mid-August, with the daily Stochastic Relative Strength Index (Stoch RSI) mid-range near 50 and no momentum edge in either direction. Objectives are the 53,000 handle then the 50-day EMA near 52,600, with invalidation on a daily close above 53,900.
Dow Jones daily chart
Dow Jones FAQs
The Dow Jones Industrial Average, one of the oldest stock market indices in the world, is compiled of the 30 most traded stocks in the US. The index is price-weighted rather than weighted by capitalization. It is calculated by summing the prices of the constituent stocks and dividing them by a factor, currently 0.152. The index was founded by Charles Dow, who also founded the Wall Street Journal. In later years it has been criticized for not being broadly representative enough because it only tracks 30 conglomerates, unlike broader indices such as the S&P 500.
Many different factors drive the Dow Jones Industrial Average (DJIA). The aggregate performance of the component companies revealed in quarterly company earnings reports is the main one. US and global macroeconomic data also contributes as it impacts on investor sentiment. The level of interest rates, set by the Federal Reserve (Fed), also influences the DJIA as it affects the cost of credit, on which many corporations are heavily reliant. Therefore, inflation can be a major driver as well as other metrics which impact the Fed decisions.
Dow Theory is a method for identifying the primary trend of the stock market developed by Charles Dow. A key step is to compare the direction of the Dow Jones Industrial Average (DJIA) and the Dow Jones Transportation Average (DJTA) and only follow trends where both are moving in the same direction. Volume is a confirmatory criteria. The theory uses elements of peak and trough analysis. Dow’s theory posits three trend phases: accumulation, when smart money starts buying or selling; public participation, when the wider public joins in; and distribution, when the smart money exits.
There are a number of ways to trade the DJIA. One is to use ETFs which allow investors to trade the DJIA as a single security, rather than having to buy shares in all 30 constituent companies. A leading example is the SPDR Dow Jones Industrial Average ETF (DIA). DJIA futures contracts enable traders to speculate on the future value of the index and Options provide the right, but not the obligation, to buy or sell the index at a predetermined price in the future. Mutual funds enable investors to buy a share of a diversified portfolio of DJIA stocks thus providing exposure to the overall index.
Author

Joshua Gibson
FXStreet
Joshua joins the FXStreet team as an Economics and Finance double major from Vancouver Island University with twelve years' experience as an independent trader focusing on technical analysis.
















