AUD/JPY Price Analysis: Seesaws around the 94.10-80 range, amidst a lack of a catalyst
- AUD/JPY extended its gains to four consecutive days,
- Worldwide weaker than expected S&P Global PMIs reignited recession fears, but the AUD held to gains.
- If the AUD/JPY breaks above 95.00, it will pave the way towards the YTD high at 96.88; otherwise, a re-test of 93.00 is on the cards.

The AUD/JPY marginally advances as the Asian session begins up by 0.01%, carrying on the momentum gathered on Tuesday, when the cross-currency pair finished the session with solid gains of 0.24%. At the time of writing, the AUD/JPY is trading at 94.69.
On Tuesday, the AUD/JPY price action witnessed the pair opening around the 94.50 area, followed by a dip towards its daily low at 94.10. However, despite a dismal sentiment in the financial markets, courtesy of dismal S&P Global PMIs readings across the globe, the AUD/JPY rallied towards its daily high at 94.85 before retreating toward current price levels.
AUD/JPY Price Analysis: Technical outlook
The AUD/JPY advance now totals four consecutive days of gains. Worth noting that on its way north, AUD/JPY buyers reclaimed the 20, 50, and 100-day EMAs. However, they had failed to clear a three-month-old downslope trendline drawn from June highs near the 94.80-95-00 area. A breach of the latter will clear the way towards the YTD high at 96.88, but buyers will need to reclaim the 96.00 mark.
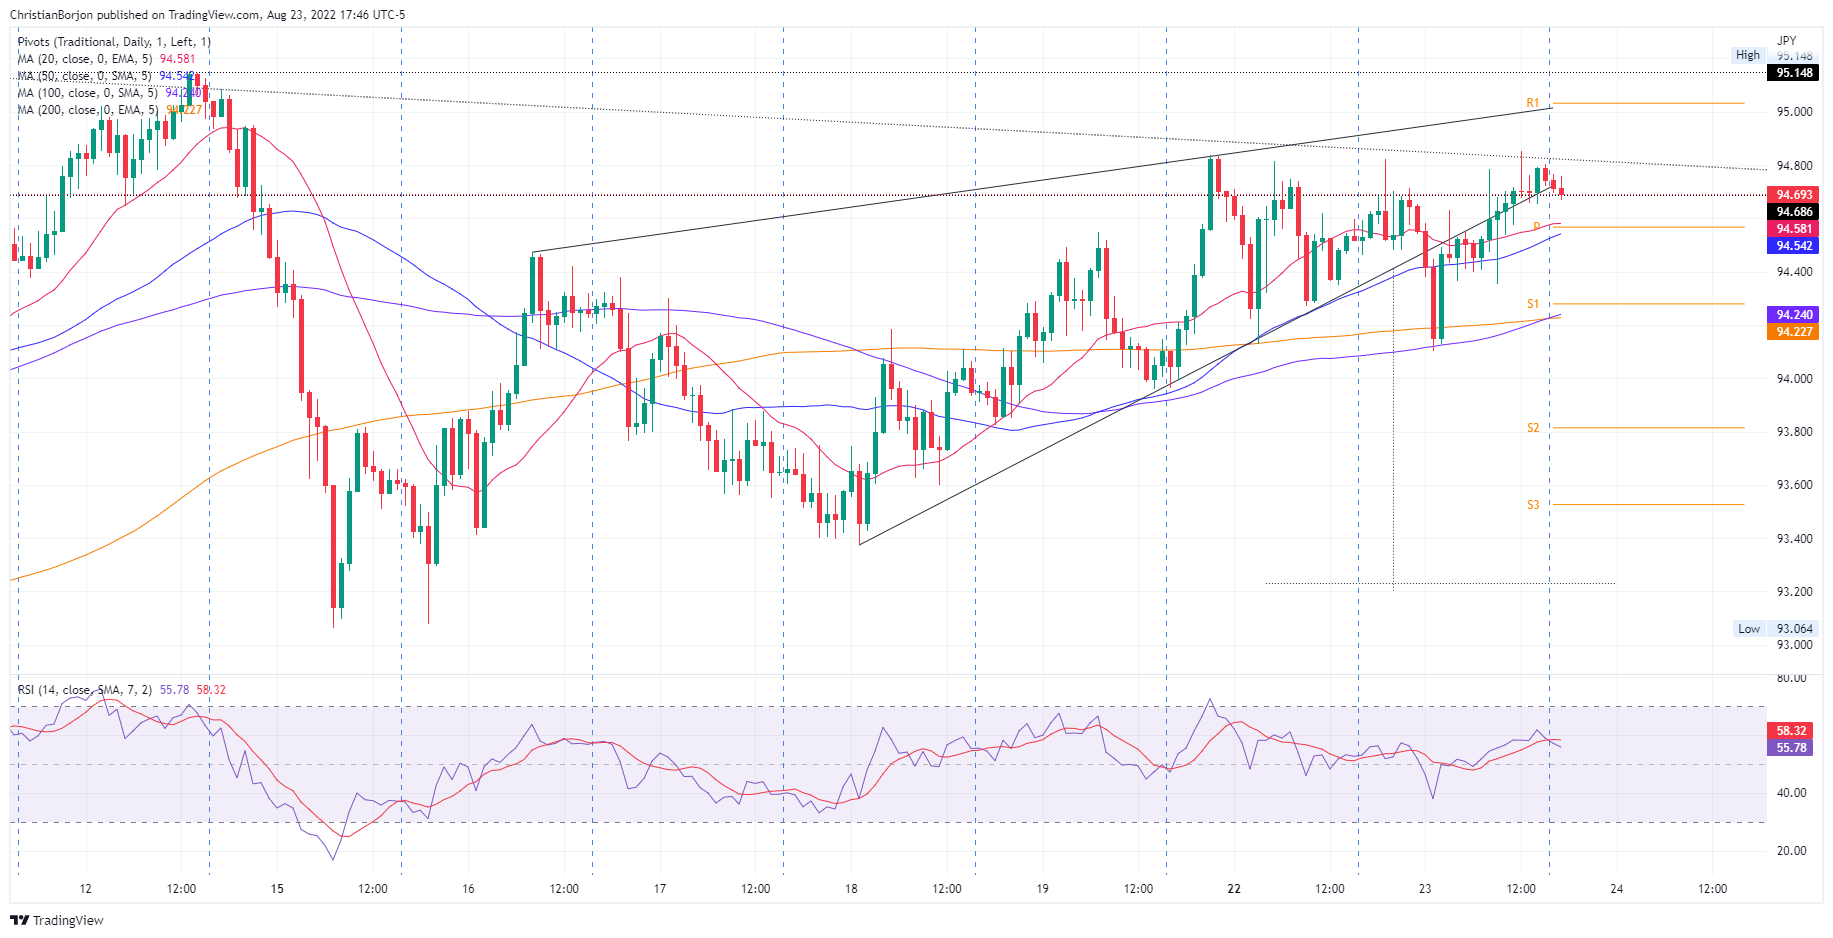
In the near term, namely the 4-hour chart, the AUD/JPY is facing solid resistance around the abovementioned trendline, putting a lid to AUD/JPY’s higher prices. Additionally, the pair is trading below an upslope trendline drawn from August 16 lows, which, acting as resistance, has kept the cross-currency pair seesawing within the 94.10-80 range.
All that said, the AUD/JPY is trading sideways. Therefore, a break above 94.80 would pave the way towards the 95.00 figure, followed by 96.00 and the YTD high at 96.88. On the flip side, the AUD/JPY first support will be the confluence of the 20-EMA and the daily pivot at around 94.57, followed by the S2 pivot at 94.28, and the confluence of the 100 and 200-EMA at 94.22.
AUD/JPY Key Technical Levels
Author

Christian Borjon Valencia
FXStreet
Markets analyst, news editor, and trading instructor with over 14 years of experience across FX, commodities, US equity indices, and global macro markets.