|

XRP Price Analysis: XRP/USD close to game-changing $0.2000 breakout

  • XRP price is trading in positive territory, with gains of some 0.45% on Monday.
  • XRP/USD bulls pushing higher for seven consecutive sessions 
  • Price action is edging out of a narrowing daily pennant structure. 

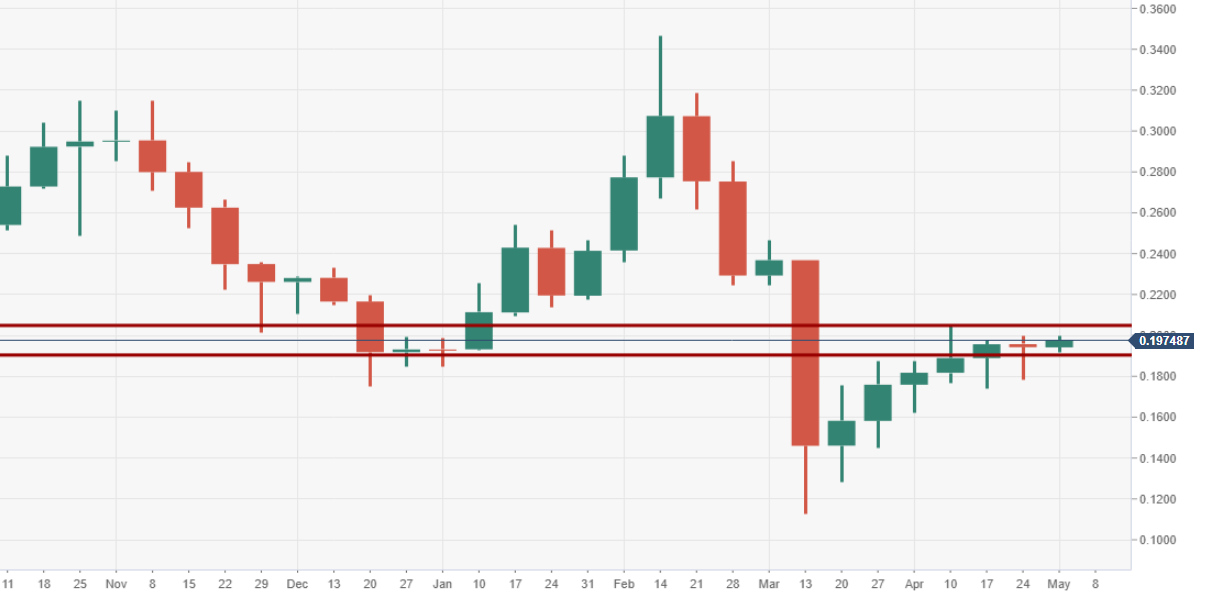
XRP/USD weekly chart

Weekly resistance is observed at $0.2000, should the bulls force a break and closure above, it will serve XRP well for greater upside momentum. 
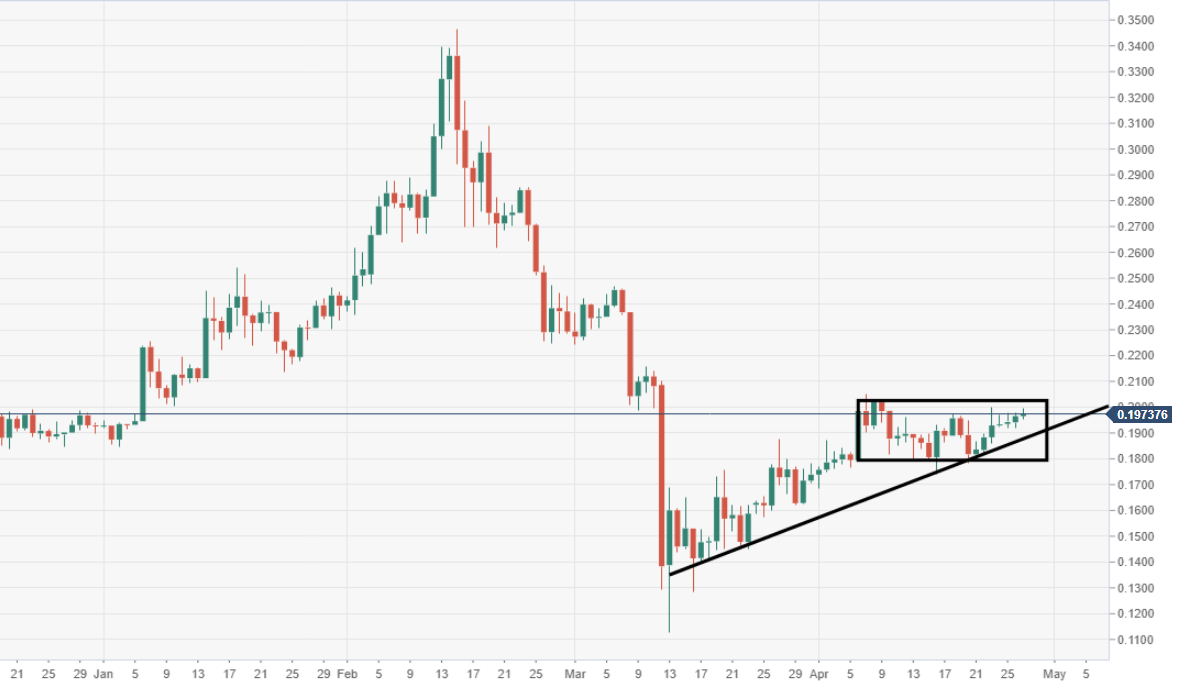
XRP/USD daily chart

The price has been stuck within a narrowing range block for some three weeks, however, showing encouraging signs of a breakout. 

Spot rate:                   0.1974

Relative change:       +0.45%

High:                          0.1997

Low:                           0.1954

XRP/USD

Overview
Today last price0.1969
Today Daily Change0.0004
Today Daily Change %0.20
Today daily open0.1965
 
Trends
Daily SMA200.1905
Daily SMA500.1784
Daily SMA1000.218
Daily SMA2000.23
 
Levels
Previous Daily High0.1977
Previous Daily Low0.1917
Previous Weekly High0.1999
Previous Weekly Low0.1784
Previous Monthly High0.2468
Previous Monthly Low0.1129
Daily Fibonacci 38.2%0.1954
Daily Fibonacci 61.8%0.194
Daily Pivot Point S10.1929
Daily Pivot Point S20.1893
Daily Pivot Point S30.1869
Daily Pivot Point R10.1989
Daily Pivot Point R20.2013
Daily Pivot Point R30.205

Author

Ken Chigbo

Ken Chigbo

Independent Analyst

Ken has over 8 years exposure to the financial markets. He started his career as an analyst, covering a variety of asset classes; forex, fixed income, commodities and equities.

More from Ken Chigbo
Share:

Editor's Picks

Ripple technical weakness persists as selling intensifies toward $1.00

Ripple grinds lower, trading around $1.10 at the time of writing on Wednesday. The sticky bearish outlook mirrors the broader crypto market, with major coins such as Bitcoin and Ethereum facing weak demand as investors de-risk.

Crypto Today: Bitcoin, Ethereum, XRP face downside pressure amid investor de-risking

Major crypto assets trade under intense headwinds on Wednesday, as market participants navigate complex geopolitical and macroeconomic environments. Bitcoin has slipped toward $61,000 after its recent rebound was sold near $64,000, leaving buyers exhausted.

Bitcoin Price Forecast: Sticky inflation fears threaten deeper sell-off in BTC

Bitcoin extends its decline on Wednesday, trading below $61,500 at the time of writing as renewed US-Iran tensions keep the risk sentiment capped. In addition, persistent capital outflows from US-listed spot Exchange Traded Funds continue to fuel selling pressure on BTC.

Pi Network extends decline as CEX outflows fail to offset bearish pressure

Pi Network edges lower on Wednesday, extending its third consecutive day of losses. The technical outlook for PI is largely bearish, with a risk of a steeper correction below $0.1184.

Bitcoin: After the bloodbath, everyone looks at $60,000
Bitcoin (BTC) hovers above $62,000 at the time of writing on Friday, weighed down by growing risk-off sentiment due to persistent geopolitical tensions in the Middle East and sticky macroeconomic uncertainty. The institutional sell-off continued to wreak havoc on capital flows, with spot Bitcoin Exchange-Traded Funds (ETFs) recording billions in outflows.