Ripple Price Analysis: XRP/USD sandwiched between SMA 200 and SMA 50 curves
- XRP/USD bears took control for the second straight day.
- The price is floating above the green Ichimoku cloud.
- MACD and Elliott Oscillator show sustained bullish market sentiment.

XRP/USD daily chart
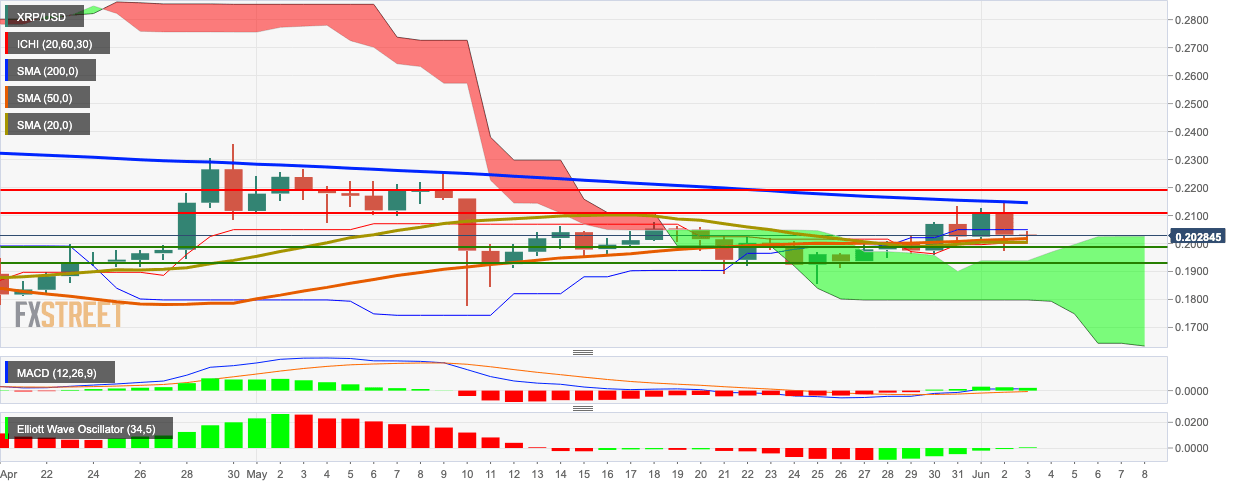
XRP/USD dropped from $0.203 to $0.2028 as Wednesday’s sessions came to a close. The price is floating above the green Ichimoku cloud and between the SMA 200 and SMA 50 curves. Despite the negative price action, the MACD and Elliott Oscillator show sustained bullish market sentiment.
Support and Resistance
XRP/USD bulls face stiff resistance at $0.2112, SMA 200 and $0.219. On the downside, there are healthy support levels at SMA 50, SMA 20, $0.1994 and $0.193
Author

Rajarshi Mitra
Independent Analyst
Rajarshi entered the blockchain space in 2016. He is a blockchain researcher who has worked for Blockgeeks and has done research work for several ICOs. He gets regularly invited to give talks on the blockchain technology and cryptocurrencies.
More from Rajarshi Mitra


