Ripple Price Analysis: XRP/USD peaks back above $0.19 as bulls retain control
- XRP/USD crossed the SMA 20 in the daily chart.
- XRP/USD 4-hour chart faces immediate resistance at the red Ichimoku cloud.

XRP/USD daily chart
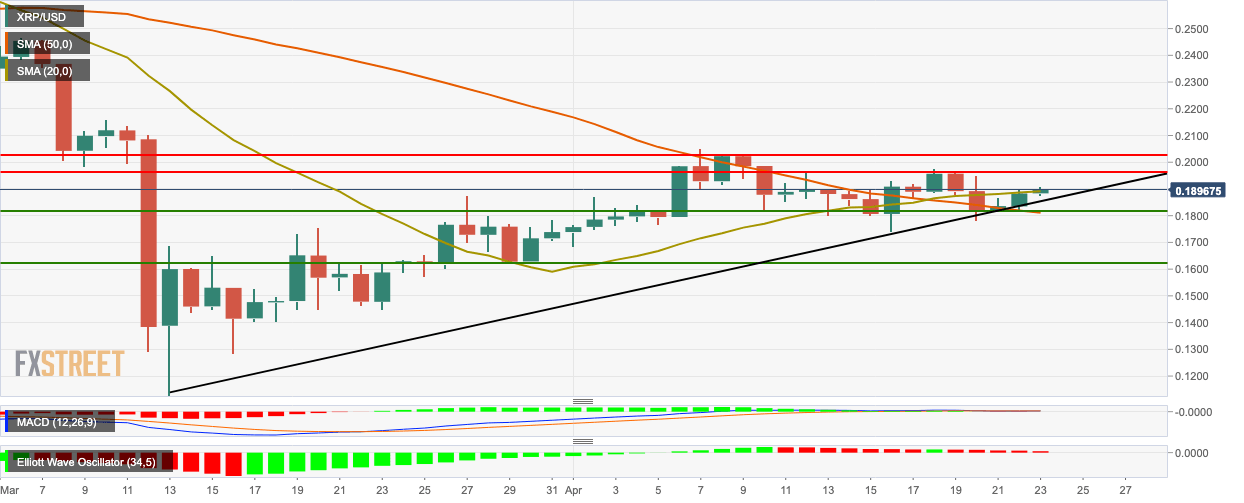
XRP/USD bulls retained control as the price jumped from $0.1883 to $0.1902. In the process, XRP/USD managed to break above the SMA 20. The MACD indicates decreasing bearish momentum, while the Elliott Oscillator had 12 red sessions out of the last 13.
XRP/USD 4-hour chart
-637232065458838739.png)
The 4-hour XRP/USD charts in an upwards channel formation as the price finds resistance at the red Ichimoku cloud. In the process, XRP/USD managed to break above the SMA 20 and SMA 50 curves. The MACD indicates increasing bullish momentum.
Key levels
Author

Rajarshi Mitra
Independent Analyst
Rajarshi entered the blockchain space in 2016. He is a blockchain researcher who has worked for Blockgeeks and has done research work for several ICOs. He gets regularly invited to give talks on the blockchain technology and cryptocurrencies.


