|

Ripple Price Analysis: XRP/USD floats inside the green Ichimoku cloud

  • XRP/USD bulls stage comeback following bearish Tuesday.
  • The MACD shows decreasing bullish momentum.

XRP/USD daily chart

XRP/USD daily chart

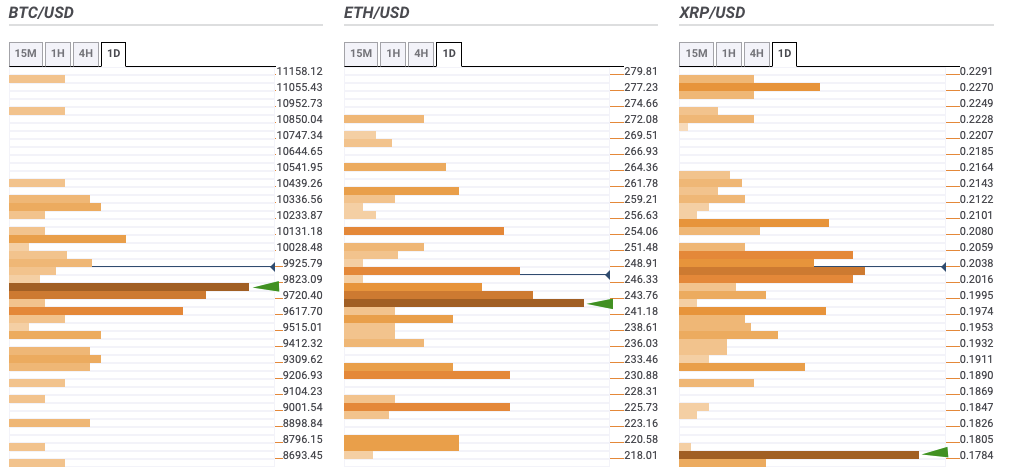
XRP/USD bulls staged a comeback after a bearish Tuesday. The price bounced went up from $0.2012 to $0.2025 and is currently floating inside the green Ichimoku cloud. The MACD shows decreasing bullish momentum.

Support and Resistance

XRP/USD has strong resistance at SMA 50, $0.2068, $0.2113 and SMA 200. On the downside, there are healthy support levels at SMA 20, $0.198 and $0.1927.

Key levels

XRP/USD

Overview
Today last price0.2024
Today Daily Change0.0011
Today Daily Change %0.55
Today daily open0.2013
 
Trends
Daily SMA200.2009
Daily SMA500.2037
Daily SMA1000.1938
Daily SMA2000.2132
 
Levels
Previous Daily High0.2053
Previous Daily Low0.1901
Previous Weekly High0.2147
Previous Weekly Low0.1973
Previous Monthly High0.2268
Previous Monthly Low0.178
Daily Fibonacci 38.2%0.1959
Daily Fibonacci 61.8%0.1995
Daily Pivot Point S10.1925
Daily Pivot Point S20.1837
Daily Pivot Point S30.1773
Daily Pivot Point R10.2077
Daily Pivot Point R20.2141
Daily Pivot Point R30.2229


Author

Rajarshi Mitra

Rajarshi Mitra

Independent Analyst

Rajarshi entered the blockchain space in 2016. He is a blockchain researcher who has worked for Blockgeeks and has done research work for several ICOs. He gets regularly invited to give talks on the blockchain technology and cryptocurrencies.

More from Rajarshi Mitra
Share:

Editor's Picks

Ripple technical weakness persists as selling intensifies toward $1.00

Ripple grinds lower, trading around $1.10 at the time of writing on Wednesday. The sticky bearish outlook mirrors the broader crypto market, with major coins such as Bitcoin and Ethereum facing weak demand as investors de-risk.

Crypto Today: Bitcoin, Ethereum, XRP face downside pressure amid investor de-risking

Major crypto assets trade under intense headwinds on Wednesday, as market participants navigate complex geopolitical and macroeconomic environments. Bitcoin has slipped toward $61,000 after its recent rebound was sold near $64,000, leaving buyers exhausted.

Bitcoin Price Forecast: Sticky inflation fears threaten deeper sell-off in BTC

Bitcoin extends its decline on Wednesday, trading below $61,500 at the time of writing as renewed US-Iran tensions keep the risk sentiment capped. In addition, persistent capital outflows from US-listed spot Exchange Traded Funds continue to fuel selling pressure on BTC.

Pi Network extends decline as CEX outflows fail to offset bearish pressure

Pi Network edges lower on Wednesday, extending its third consecutive day of losses. The technical outlook for PI is largely bearish, with a risk of a steeper correction below $0.1184.

Bitcoin: After the bloodbath, everyone looks at $60,000
Bitcoin (BTC) hovers above $62,000 at the time of writing on Friday, weighed down by growing risk-off sentiment due to persistent geopolitical tensions in the Middle East and sticky macroeconomic uncertainty. The institutional sell-off continued to wreak havoc on capital flows, with spot Bitcoin Exchange-Traded Funds (ETFs) recording billions in outflows.