Pi Network Price Forecast: PI flags further correction risk as bearish momentum accelerates
- Pi Network extends losses below its 50-day EMA at $0.1777 after breaking below a symmetrical triangle pattern.
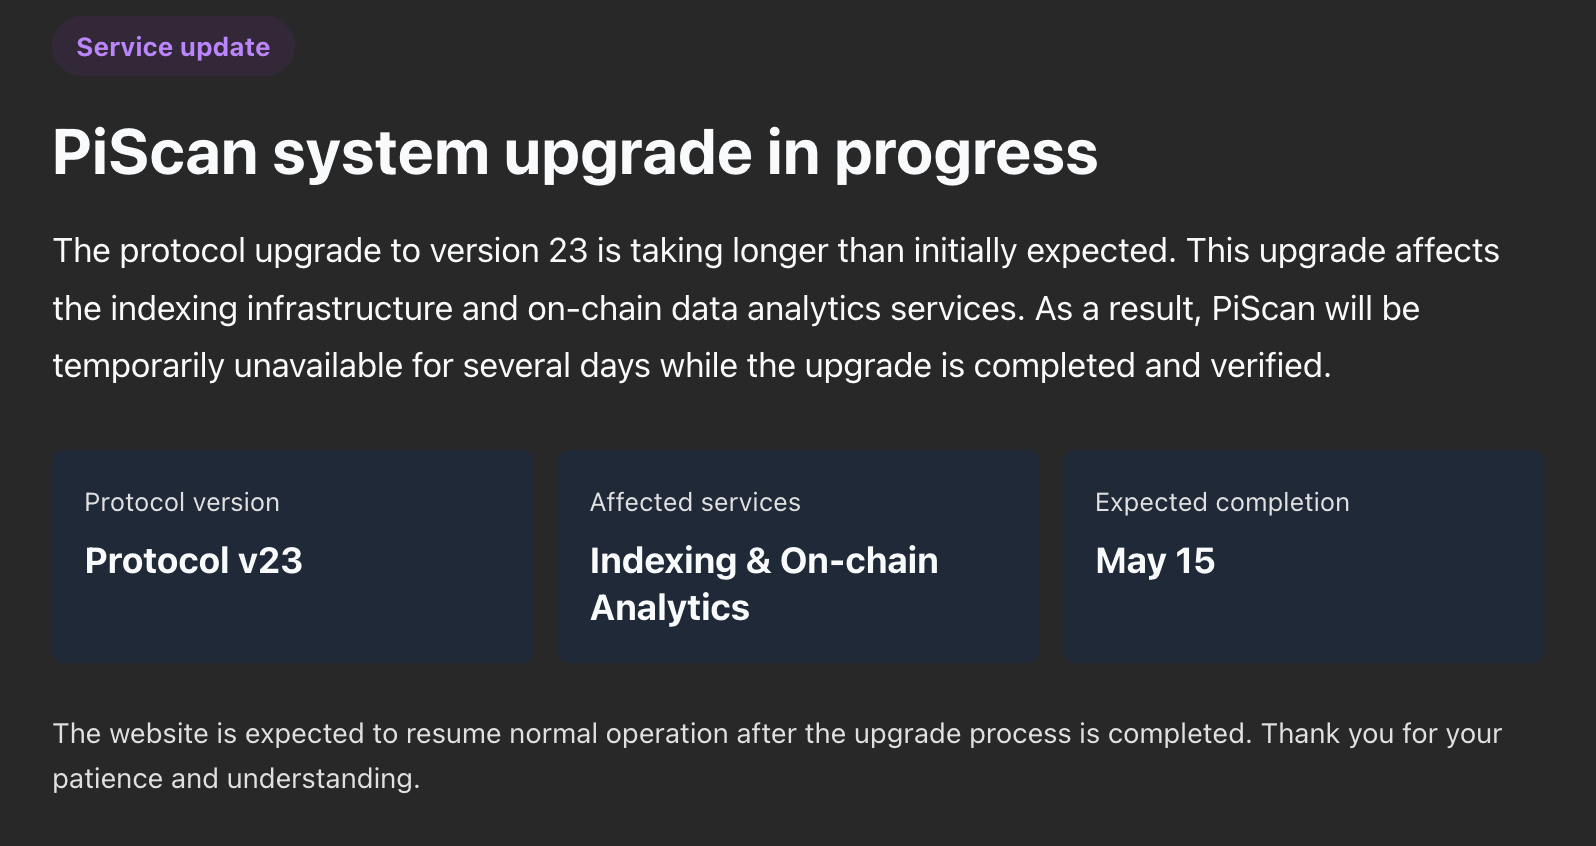
- Heightened volatility across the broader crypto market and the upcoming Protocol v23 upgrade deadline on Friday weigh on Pi Network.
- The technical outlook is cautiously bearish, as momentum indicators signal a rise in selling pressure.

Pi Network edges lower on Monday, risking a steeper correction below $0.1700 amid the broader crypto market shake-off. PiScan, the on-chain analytics platform for Pi Network, is down amid the Mainnet upgrade to protocol v23, which is pressuring retail strength. The technical outlook for Pi Network is increasingly bearish, as indicators such as RSI and MACD are flashing sell signals.
Demand wanes amid mainnet upgrade
Pi Network falls on the day, but holds above $0.1700 on Monday. The upcoming mainnet upgrade to protocol v23, with a deadline on Friday, has stopped operations on PiScan, which could negatively impact the retail sentiment. The upgrade also places additional strain on nodes to keep them connected to the network.
These internal headwinds collide with a broader market sentiment that is also under pressure, with total liquidations crossing $400 million over the last 24 hours, while the Crypto Fear and Greed Index by CoinMarketCap remains neutral at 50, down from 52 on Sunday, suggesting increased volatility amid indecision as previously reported by FXStreet.
Speculative and community-driven tokens, such as Pi Network and other meme coins, typically struggle to sustain momentum at such times.
Pi Network risks rolling down a bearish slope
Pi Network keeps a bearish near-term tone as price holds beneath a dense confluence of the 50-day and 100-day Exponential Moving Averages (EMAs)at $0.1777 and $0.1838, respectively. Meanwhile, intraday losses risk erasing the two-day recovery and extending the bearish breakout of a symmetrical triangle pattern on the daily chart.
The upward support trendline, now broken around $0.1770, reinforces overhead supply alongside the downward resistance trend line near $0.1798. The path of least resistance for PI highlights the $0.1633 support level as the next area for buyers to regain control, guarding the downside to the February 23 low at $0.1556.
Bearish momentum is accelerating on the daily chart, with the Relative Strength Index (RSI) slipping below the midline to about 45, while the Moving Average Convergence Divergence (MACD) histogram has flipped negative after a crossover on Thursday, suggesting waning buying interest after prior attempts to recover.
Looking up, the initial resistance is located at the former rising trend support trendline around $0.1770, followed closely by the 50-day EMA at $0.1777, forming a nearby cap that bulls would need to clear to ease immediate pressure. Above that, the downward resistance trendline at $0.1798 and the 100-day EMA at $0.1838 create a broader supply zone, while the 200-day EMA, higher up near $0.2339, marks a more distant barrier that defines the wider bearish structure.
(The technical analysis of this story was written with the help of an AI tool.)
Author

Vishal Dixit
FXStreet
Vishal Dixit holds a B.Sc. in Chemistry from Wilson College but found his true calling in the world of crypto.



