Ethereum Price Forecast: US interest stays weak amid strong ETH ETF outflows

Ethereum price today: $2,130
- Ethereum holds above $2,100 following President Trump's statement that the US is in the final stages of negotiations with Iran.
- US sentiment in Ethereum continues to decline following a seven-day outflow streak in ETH ETFs.
- Bulls are defending the $2,108 support level.
Ethereum (ETH) holds above $2,100 on Wednesday following the latest developments surrounding the US-Iran crisis. US President Donald Trump said that the country is in the final stages of negotiations with Iran, but warned of further attacks if a deal isn't reached.
"We're in the final stages of Iran. We'll see what happens. Either have a deal or we're going to do some things that are a little bit nasty, but hopefully that won't happen," Trump told reporters on Wednesday.
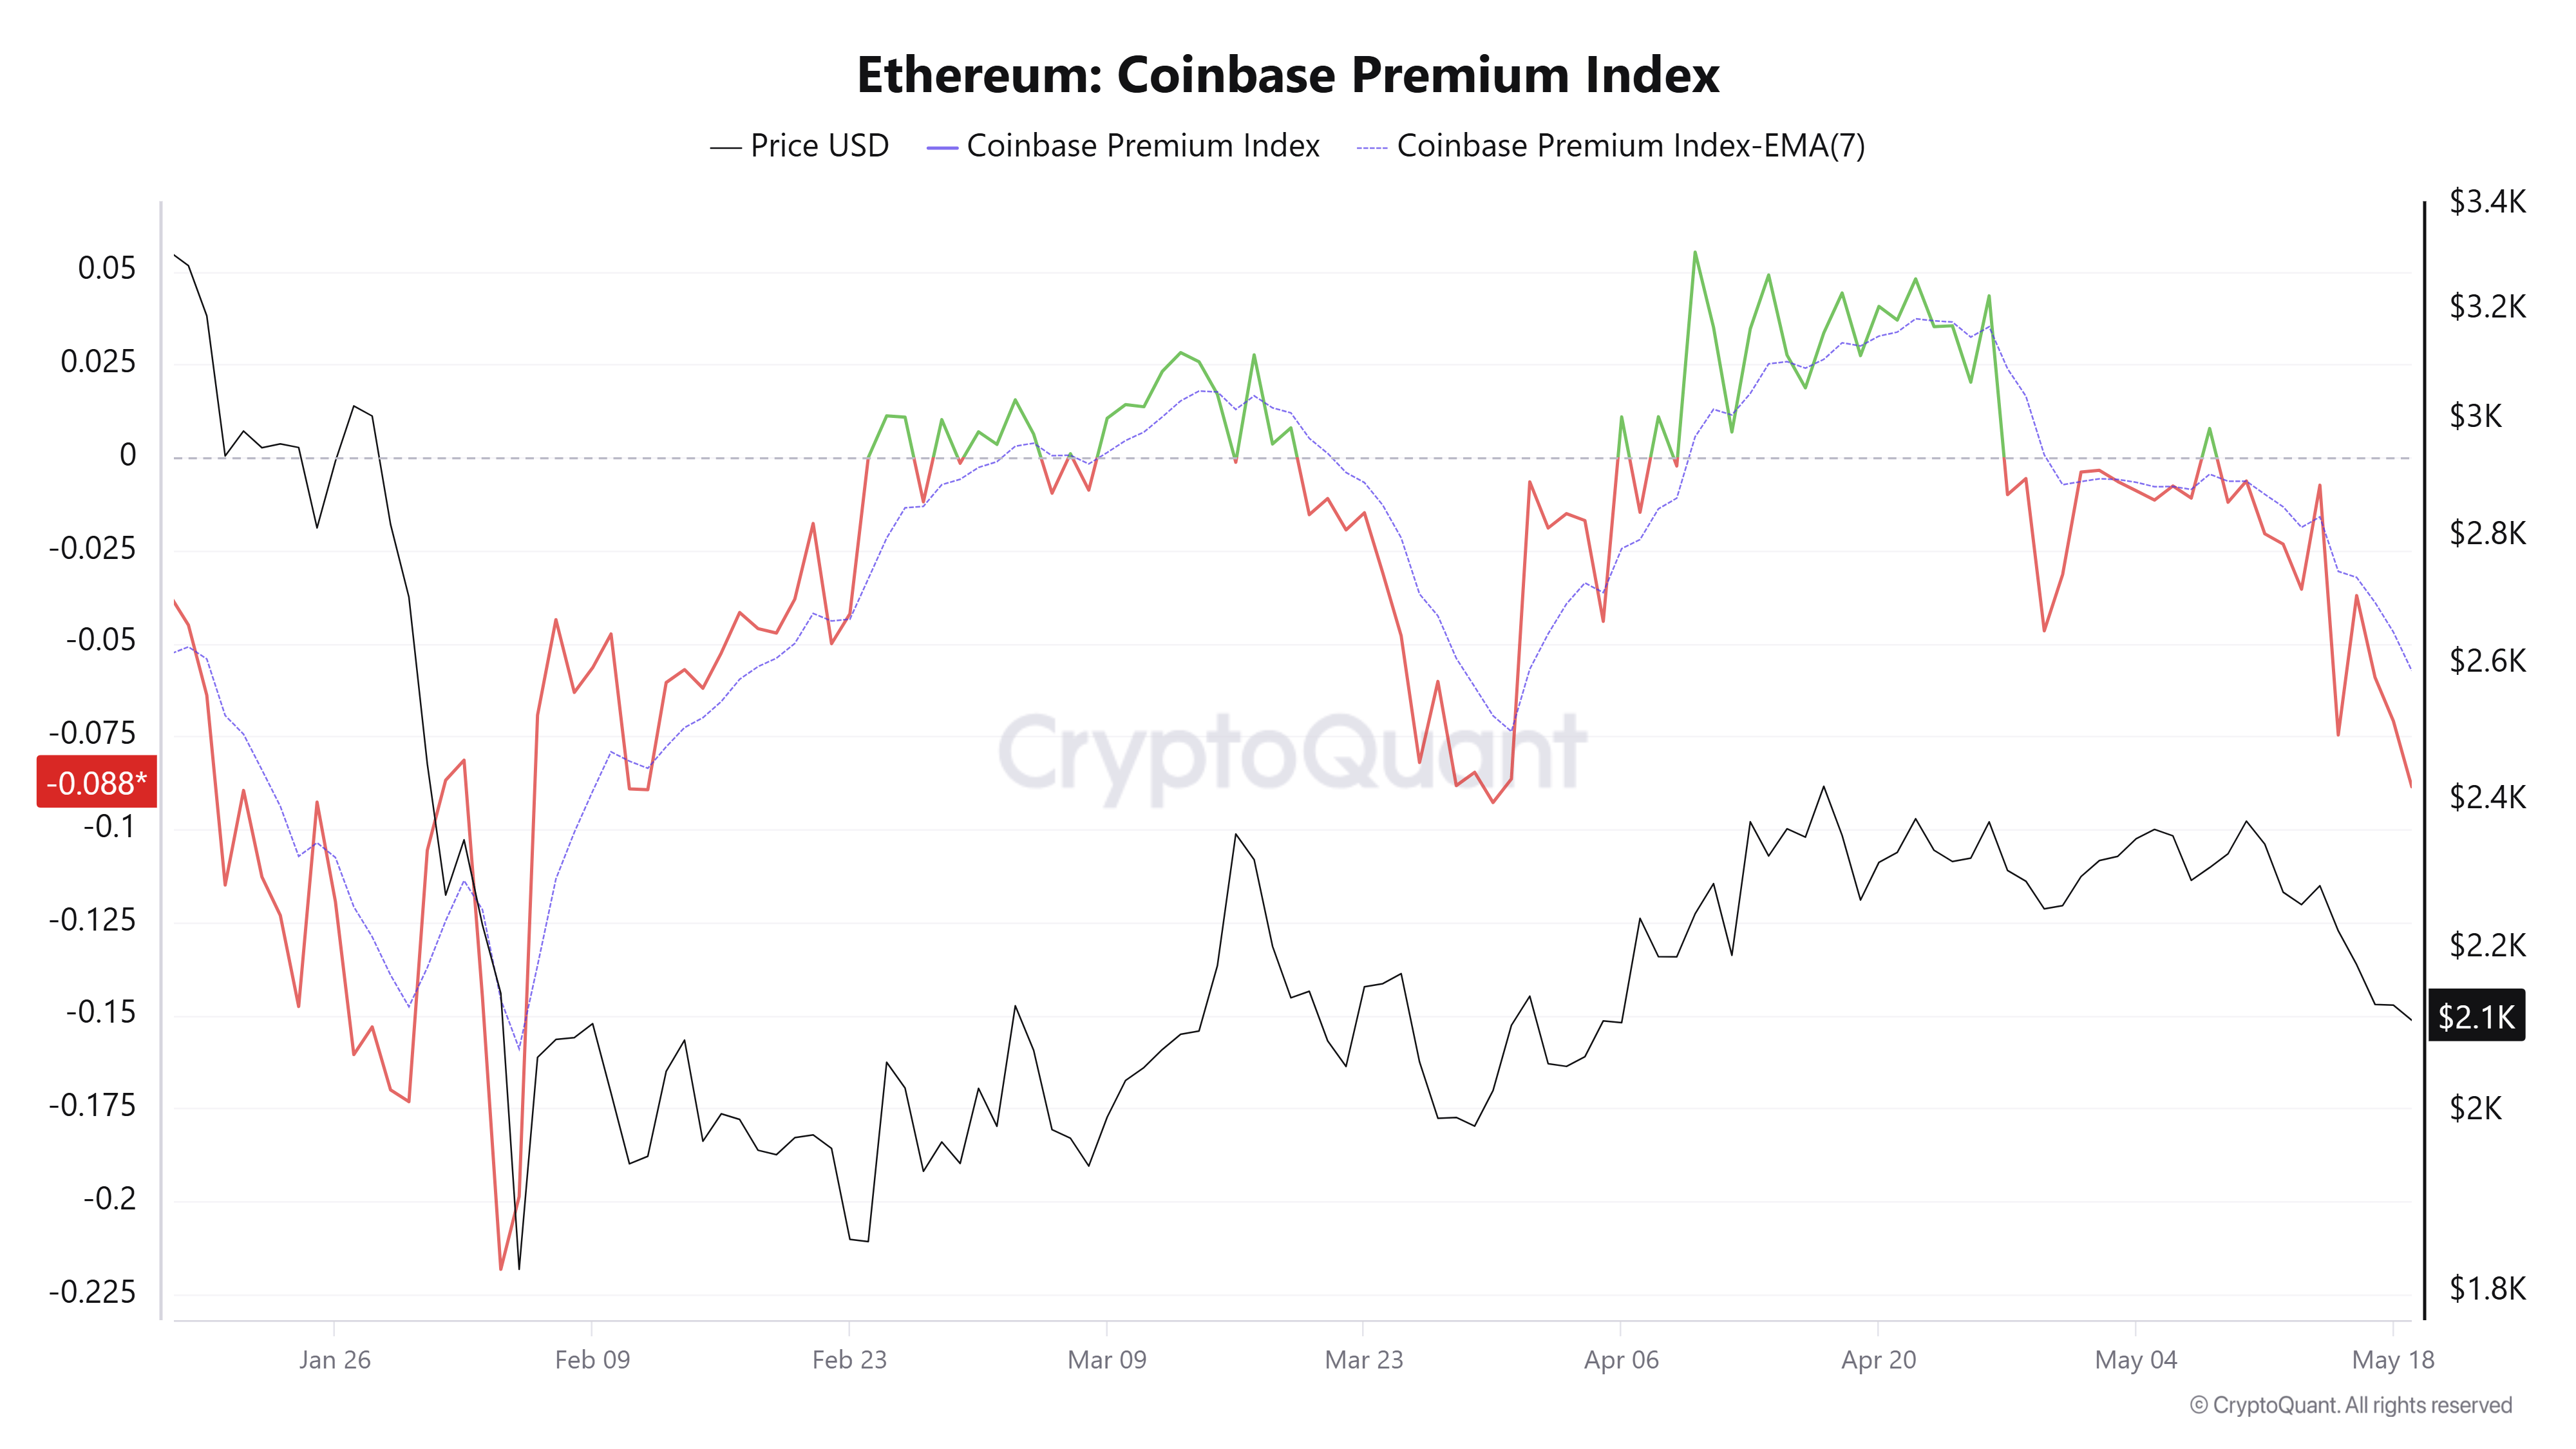
Against that backdrop, amid strong inflation and rising US Treasury yields, interest in ETH among US investors has continued to decline, as evidenced by the Coinbase Premium Index, which serves as a measure of US investors' sentiment.
The index, which compares ETH's prices on Coinbase and Binance, has plunged deeper into negative territory, maintaining a downtrend that began in late April.
US spot ETH exchange-traded funds (ETFs) confirm the risk-off sentiment in the region, posting seven consecutive days of negative flows after recording $62.3 million in net outflows on Tuesday, according to SoSoValue data.
On the derivatives side, Ethereum's futures open interest has added roughly 500K ETH since Monday, partly covering the gap from its more than 1 million ETH decline over the weekend following strong long liquidations.
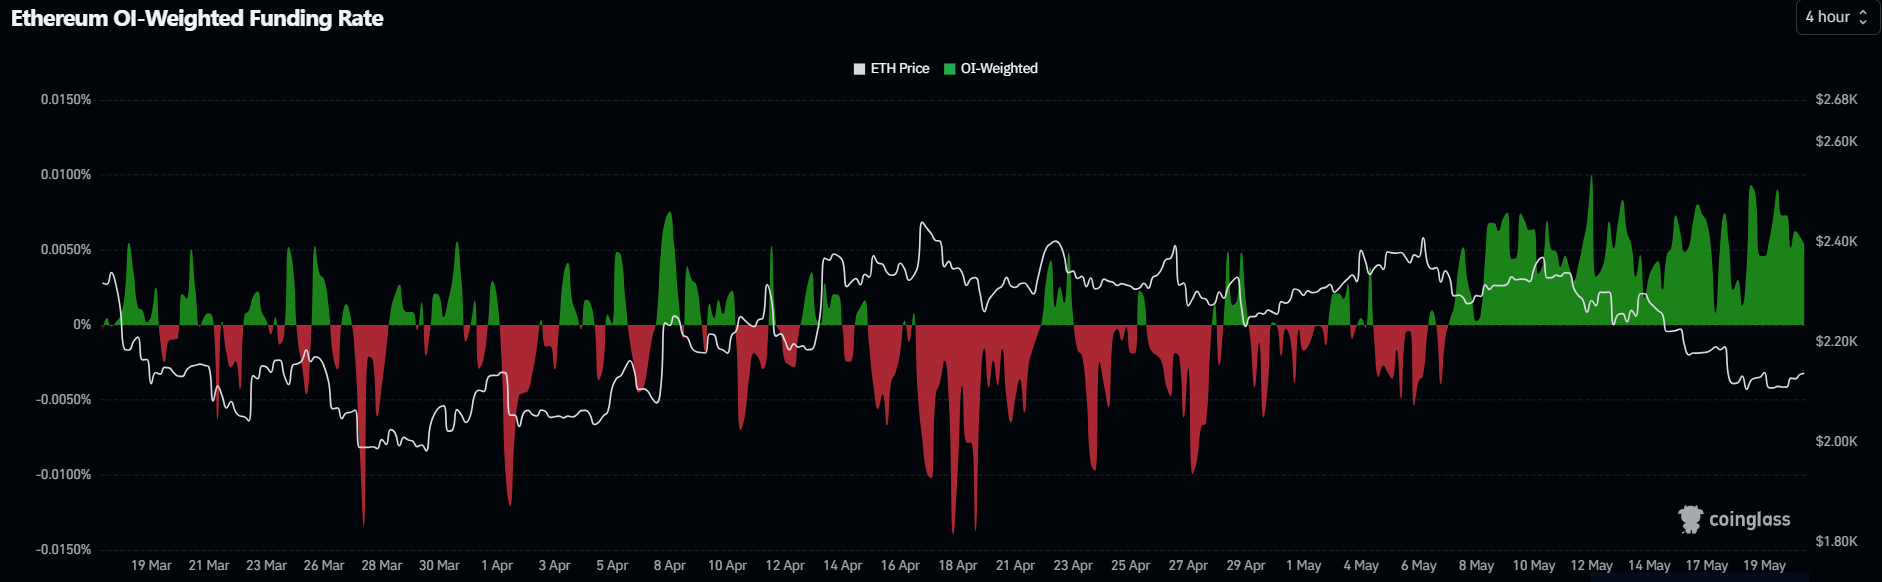
Despite the price decline and liquidations, ETH funding rates remained positive, suggesting bulls are buying the dip with leverage.
Ethereum Price Forecast: Bulls defend $2,108 support
On the daily chart, ETH is extending its bearish bias as price holds beneath the 20-, 50-, and 100-day Exponential Moving Averages (EMAs), which are clustered between roughly $2,234 and $2,328. The loss of altitude below these trend filters leaves the pair capped by a dense overhead supply zone. At the same time, the Relative Strength Index (RSI) is near 37, and a deeply oversold Stochastic Oscillator (Stoch) hints that downside momentum remains dominant but could start to fatigue on further dips.
On the topside, initial resistance emerges at the horizontal barrier around $2,211, ahead of the 20-day EMA at $2,234 and the 50-day EMA at $2,247, with the 100-day EMA near $2,328 reinforcing a broader cap before the next hurdle at $2,389. Further north, $2,746 and $3,412 stand as medium-term resistance levels.
On the downside, immediate support is seen at $2,108, where a horizontal floor protects the recent pullback, with subsequent cushions at $1,909 and $1,741. A break below these would expose deeper supports near $1,524 and $1,405.
(The technical analysis of this story was written with the help of an AI tool.)
Author

Michael Ebiekutan
FXStreet
With a deep passion for web3 technology, he's collaborated with industry-leading brands like Mara, ITAK, and FXStreet in delivering groundbreaking reports on web3's transformative potential across diverse sectors. In addition to




