Dogecoin Price Forecast: DOGE bounces off key support, resistance trendline in focus
- Dogecoin extends gains toward $0.075 on Friday after a roughly 3% surge the previous day.
- DOGE ETFs recorded their third-ever outflow on Thursday, while rising Open Interest and funding rate reflect firm retail demand.
- The technical outlook for DOGE is optimistic, as easing oversold momentum hints at a bullish trend reversal.

Dogecoin (DOGE) price approaches $0.075 on Friday following a 3% rebound the previous day as the broader market risk-off sentiment eases. The meme coin regains retail strength as DOGE futures Open Interest and the funding rate increase. The technical outlook for DOGE reflects oversold bearish momentum, which could extend the rebound and test the breakout of the resistance trendline near $0.07766.
Dogecoin ETFs trim holdings while retail demand renews
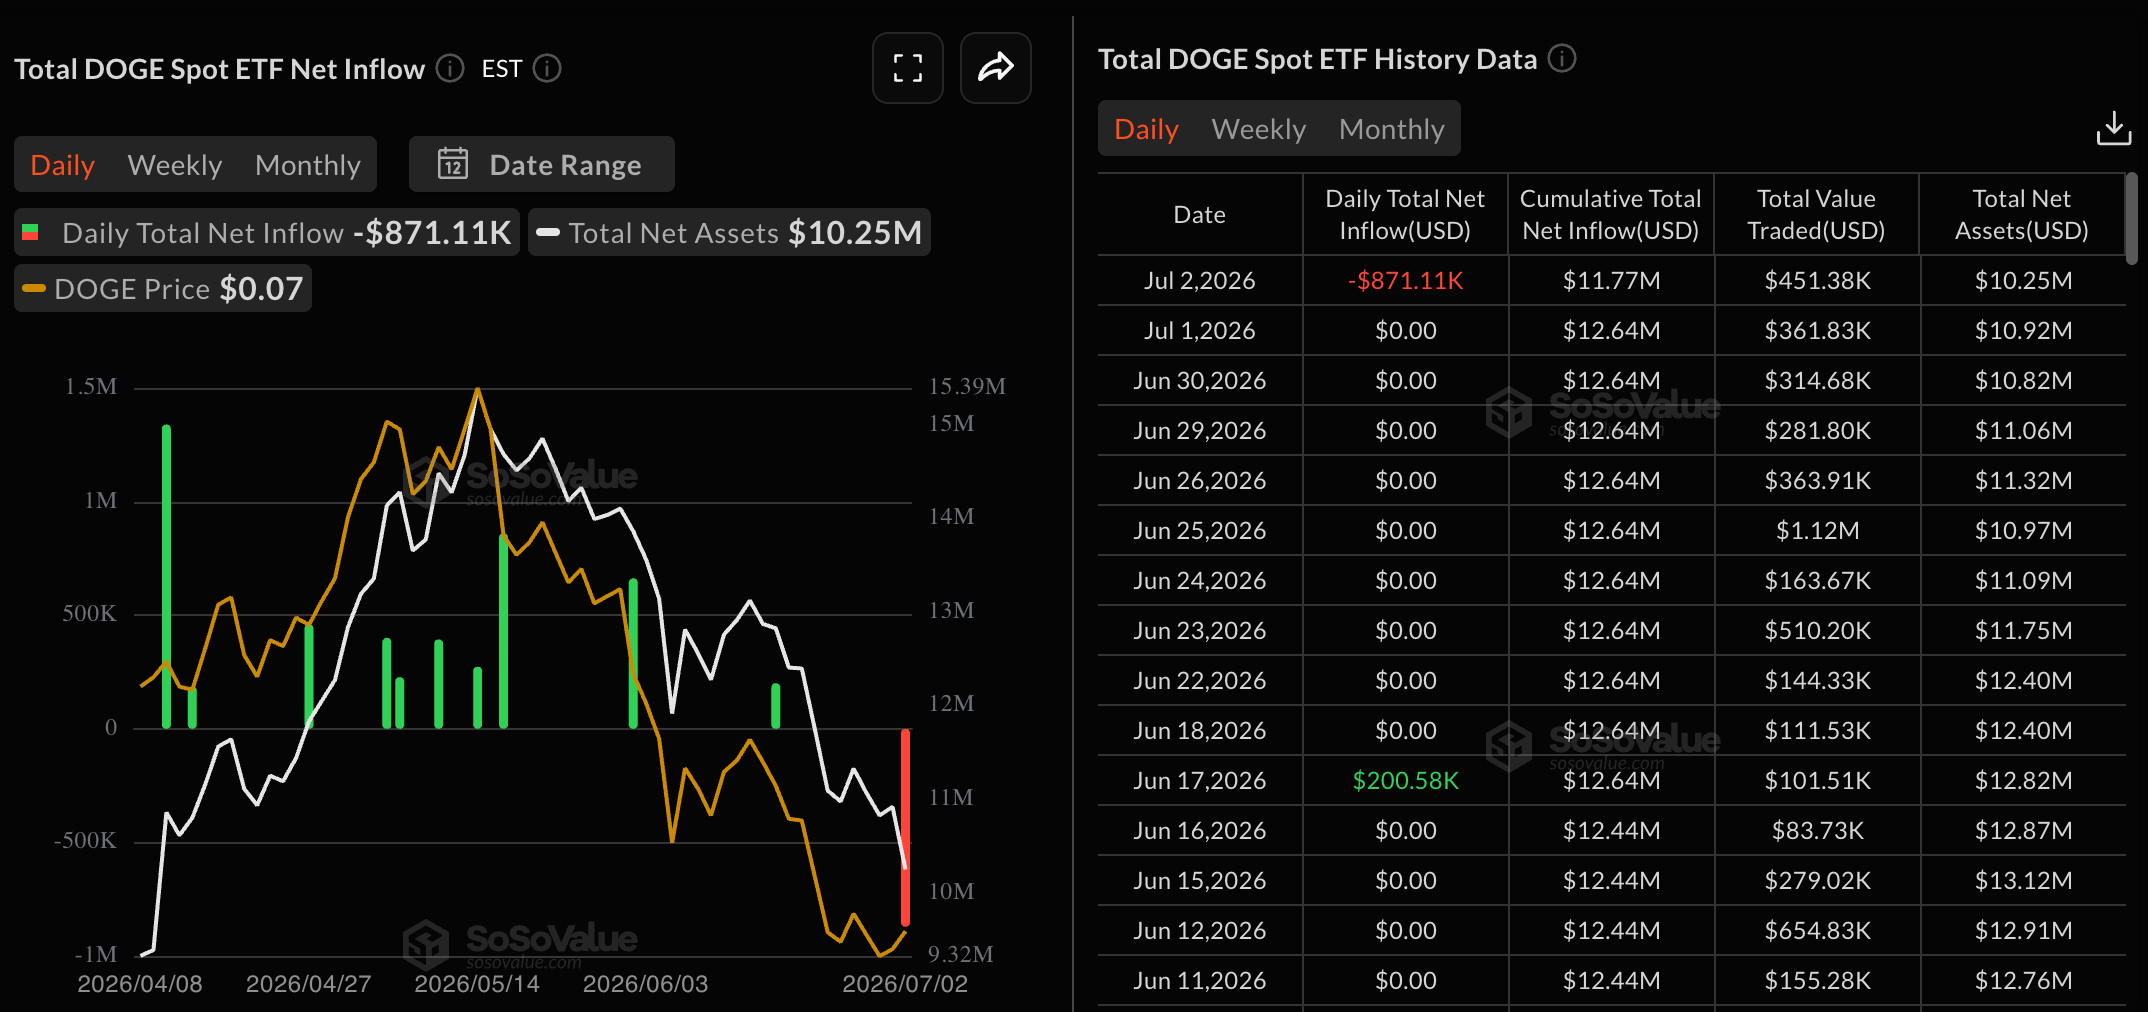
Dogecoin lacks steady institutional demand while retail support shows early signals of renewal. DOGE-focused Exchange Traded Funds (ETFs) recorded $871,110 in outflows on Thursday, marking their third-ever outflow since inception. The outflow occurs after nine consecutive sessions of zero outflow, which reaffirms a muted-to-bearish institutional outlook in the short term.
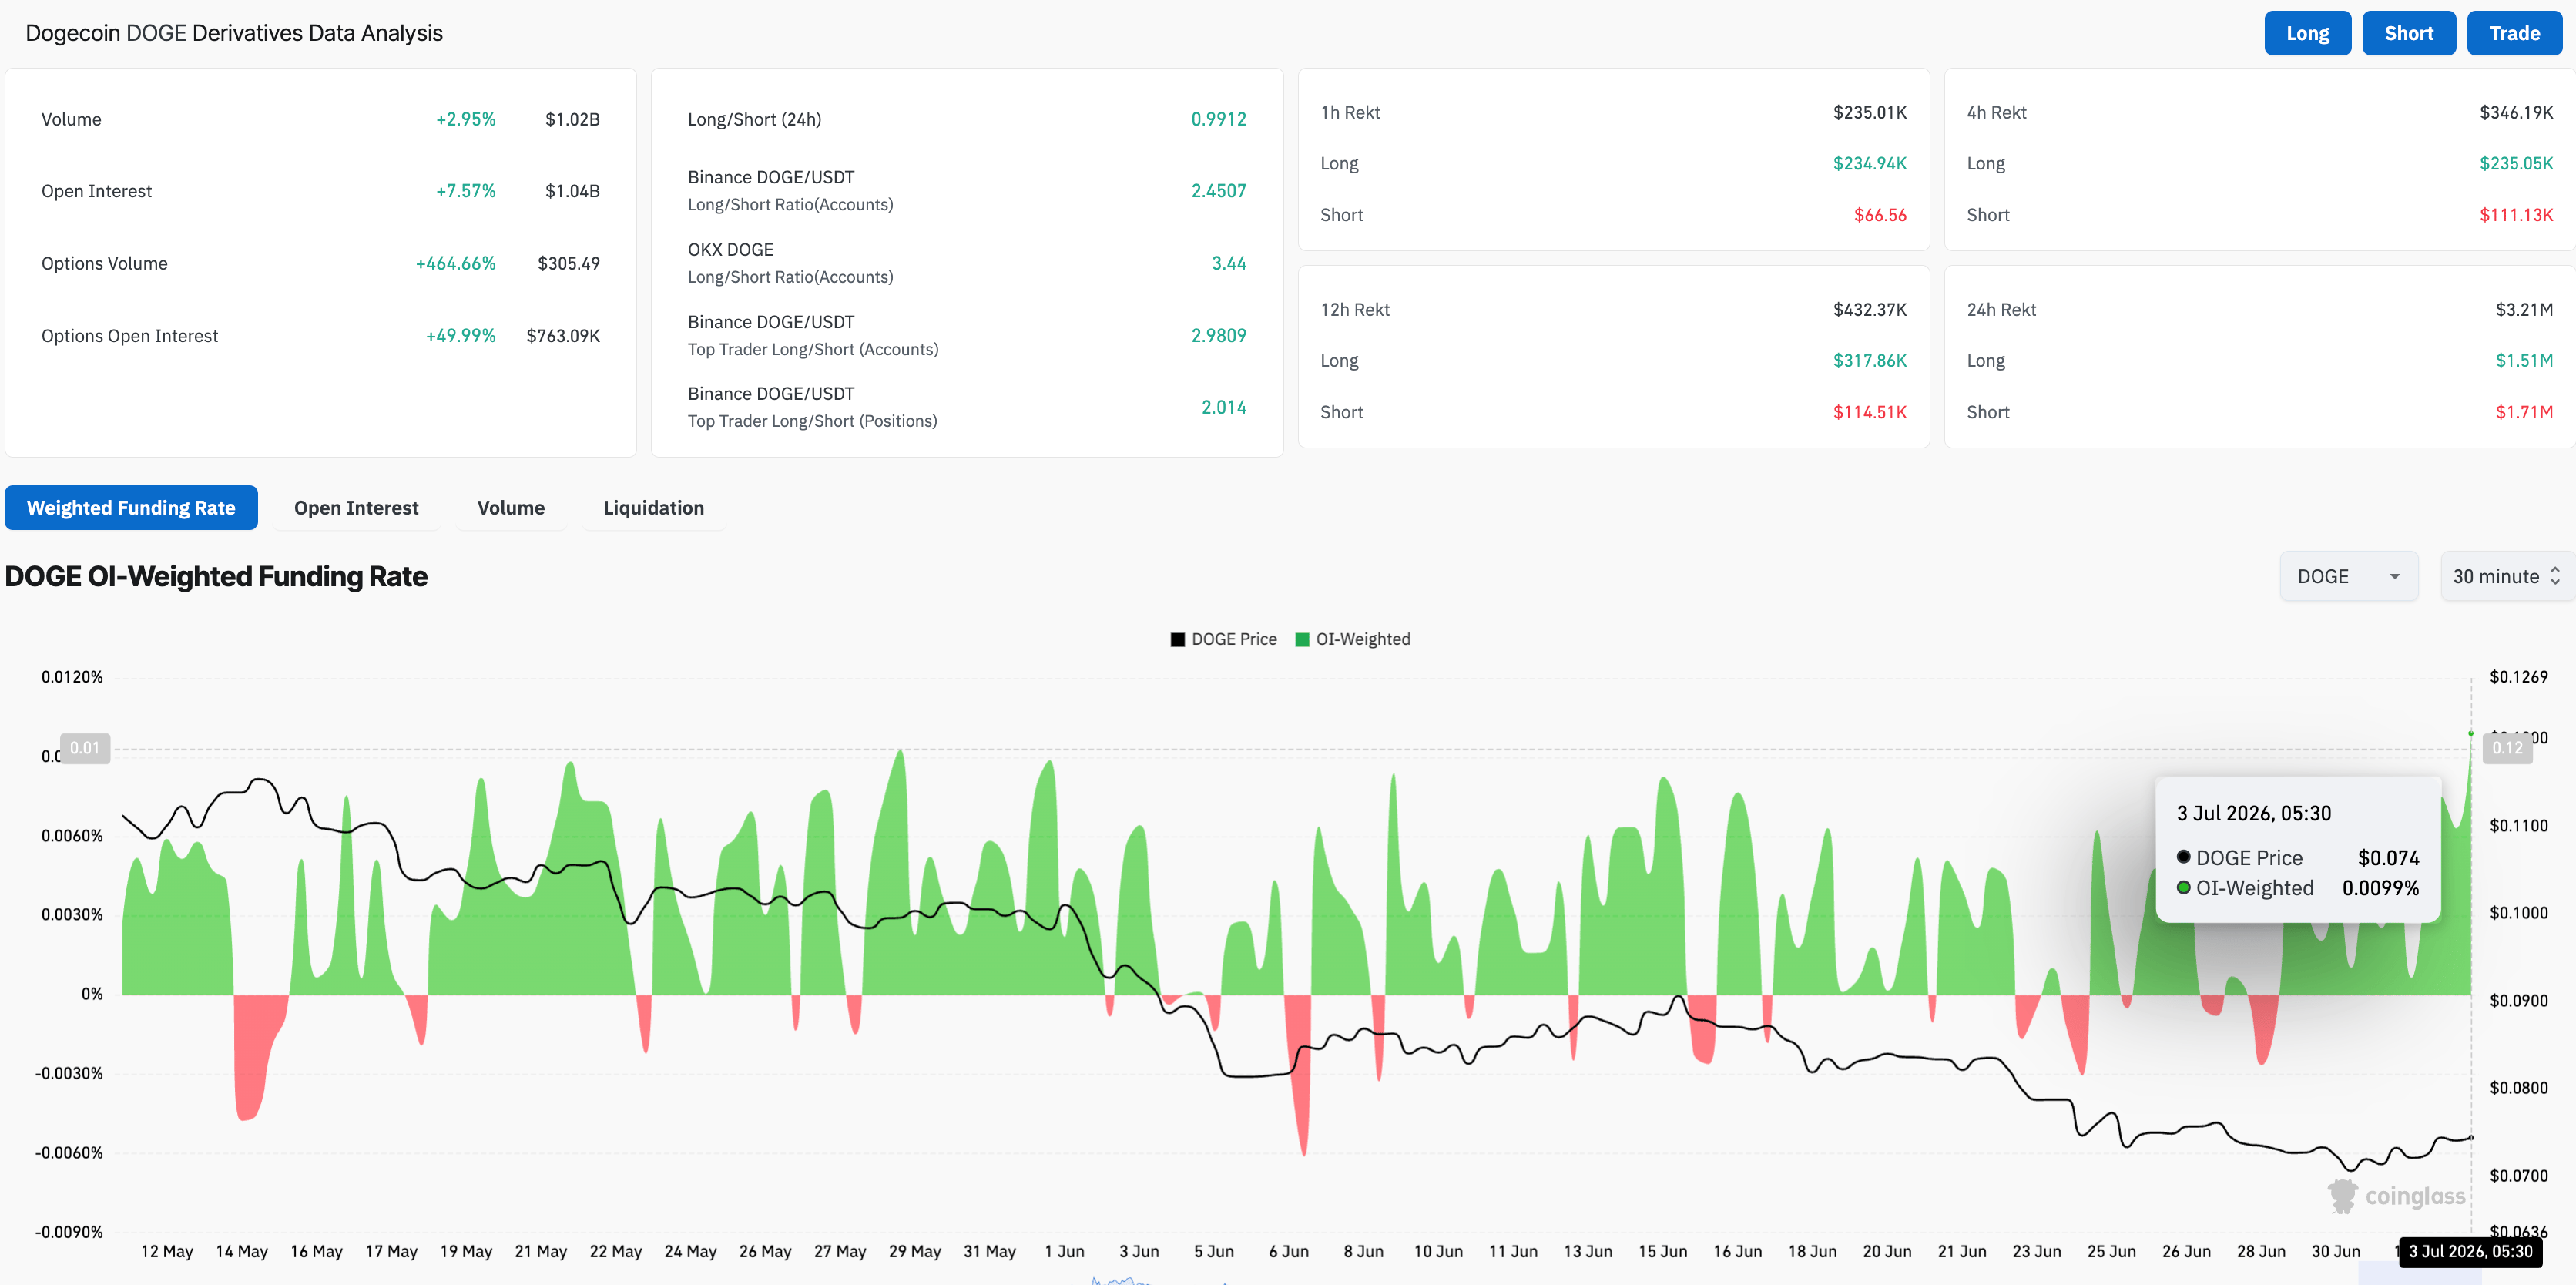
On the retail front, CoinGlass data shows that DOGE futures Open Interest (OI) is up over 7% in the last 24 hours to $1.04 billion, reflecting an increase in positional buildup, while trading volume remains steady at around $1.02 billion. In addition, the positive spike in the funding rate to 0.0099% reflects risk-on sentiment among traders, who are willing to take long positions at a premium.
Dogecoin's recovery from key support nears key resistance trendline
Dogecoin keeps steady on Friday, following a 3% surge the previous day, which indicates a minor recovery patch within a broader bearish trend. DOGE holds below the 50-day Exponential Moving Average (EMA) at roughly $0.0863 and the 200-day EMA near $0.1093.
From a technical perspective, the rebound in DOGE from the $0.0700 support level forms a morning star pattern, hinting at an extended recovery toward an overhead trendline near $0.0776. A decisive close above this level would confirm the trendline breakout, positioning Dogecoin for an extended rally toward the 50-day EMA at $0.0863.
The momentum on the daily timeframe shows easing bearish pressure. The Relative Strength Index (RSI) at 32 shows a recovery after being oversold earlier this week, while the Moving Average Convergence Divergence (MACD) has marginally crossed above its signal line, hinting at waning downside momentum but not yet challenging the dominant overhead structure.
On the downside, immediate support is aligned at $0.0700, ahead of a more significant horizontal floor around $0.0642, where failure would expose further weakness despite the nascent improvement in momentum indicators.
(The technical analysis of this story was written with the help of an AI tool.)
Author

Vishal Dixit
FXStreet
Vishal Dixit holds a B.Sc. in Chemistry from Wilson College but found his true calling in the world of crypto.