Cardano Price Forecast: ADA falls back under market pressure amid a silver lining
- Cardano remains below $0.25 on Tuesday after a failed recovery attempt on Monday.
- Derivatives data signal a risk-off sentiment among traders amid broader market volatility.
- On-chain data shows an increase in whale holdings to a four-month high, projecting long-term confidence.

Cardano (ADA) trades below $0.2500 at press time on Tuesday, extending a bearish start to the week amid a broader cryptocurrency market that is whipsawing ahead of the US-Iran deadline. Derivatives data point to near-term risk-off sentiment among traders, while on-chain data shows large wallet investors, commonly known as whales, accumulating for the long term.
Whales bet on the long-term while traders focus on the near-term downside
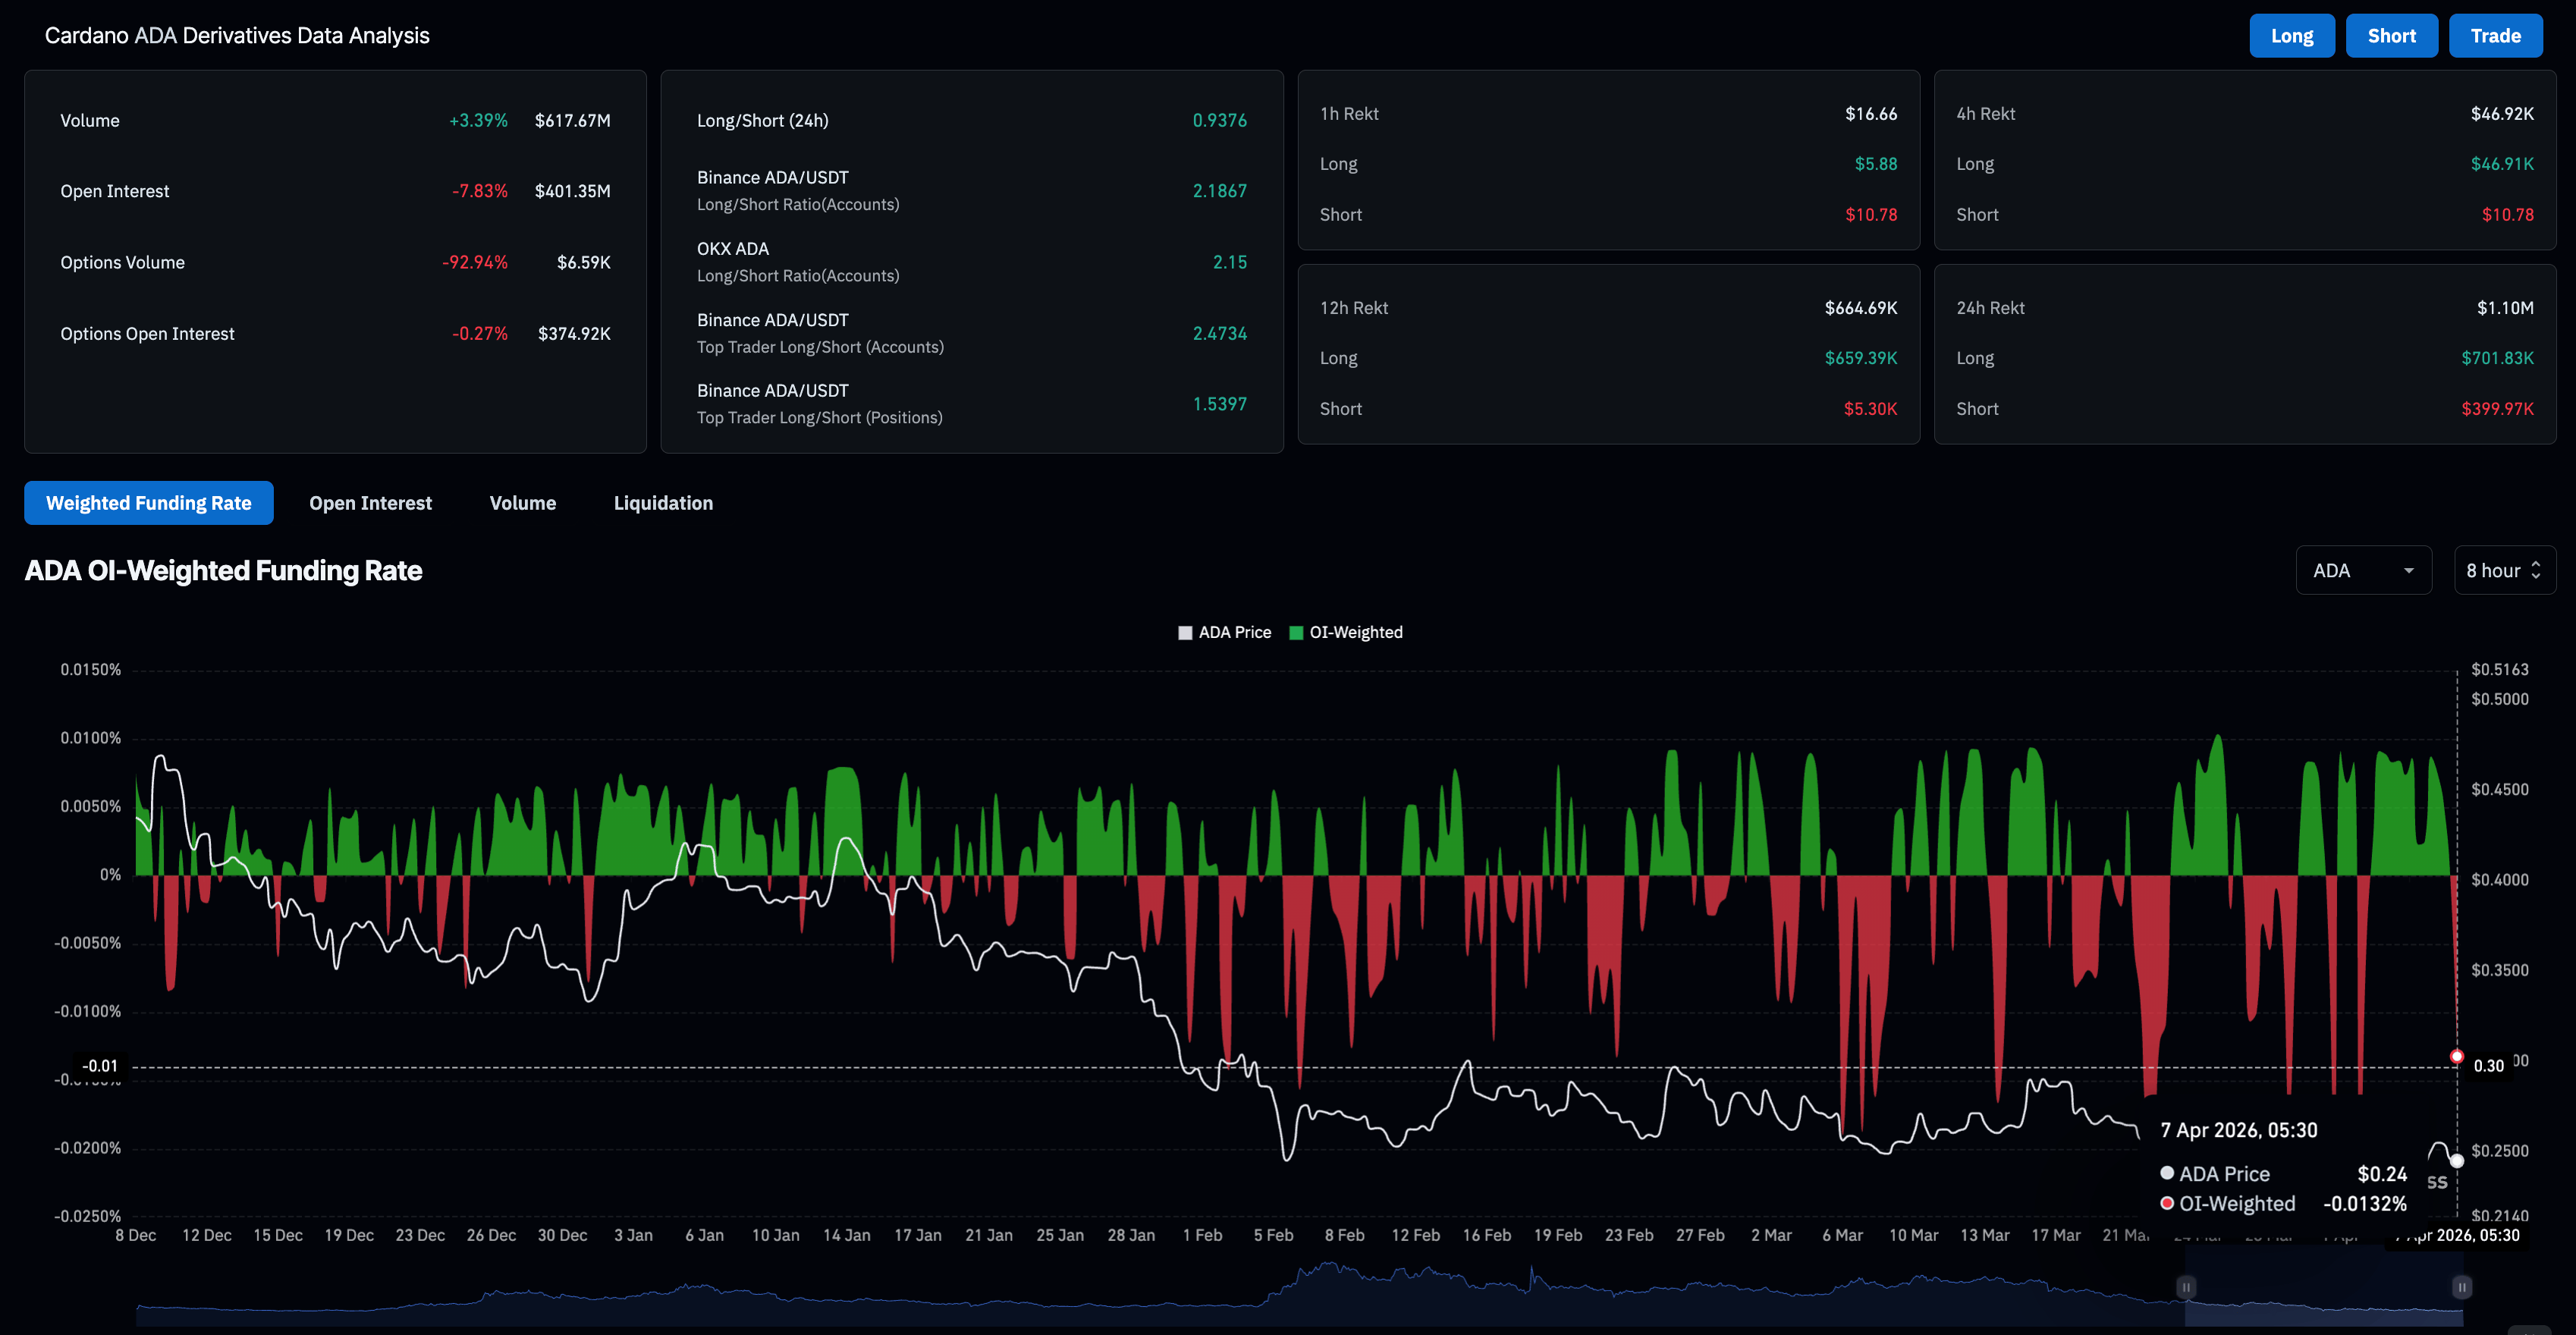
Cardano loses strength in the derivative market after Monday’s flipped recovery. CoinGlass data shows the ADA futures Open Interest (OI) is at $401.35 million, down roughly 8% in the last 24 hours, confirming the reduced value of existing positions. Meanwhile, total liquidations reach $1.10 million in the same period, led by $701,830 in long liquidations, which reaffirm a weakened bullish stance.
The OI-weighted funding rate has dropped to -0.0132%, suggesting that traders are inclined to hold short positions at a premium. This reflects sell-side dominance among traders in the near term.
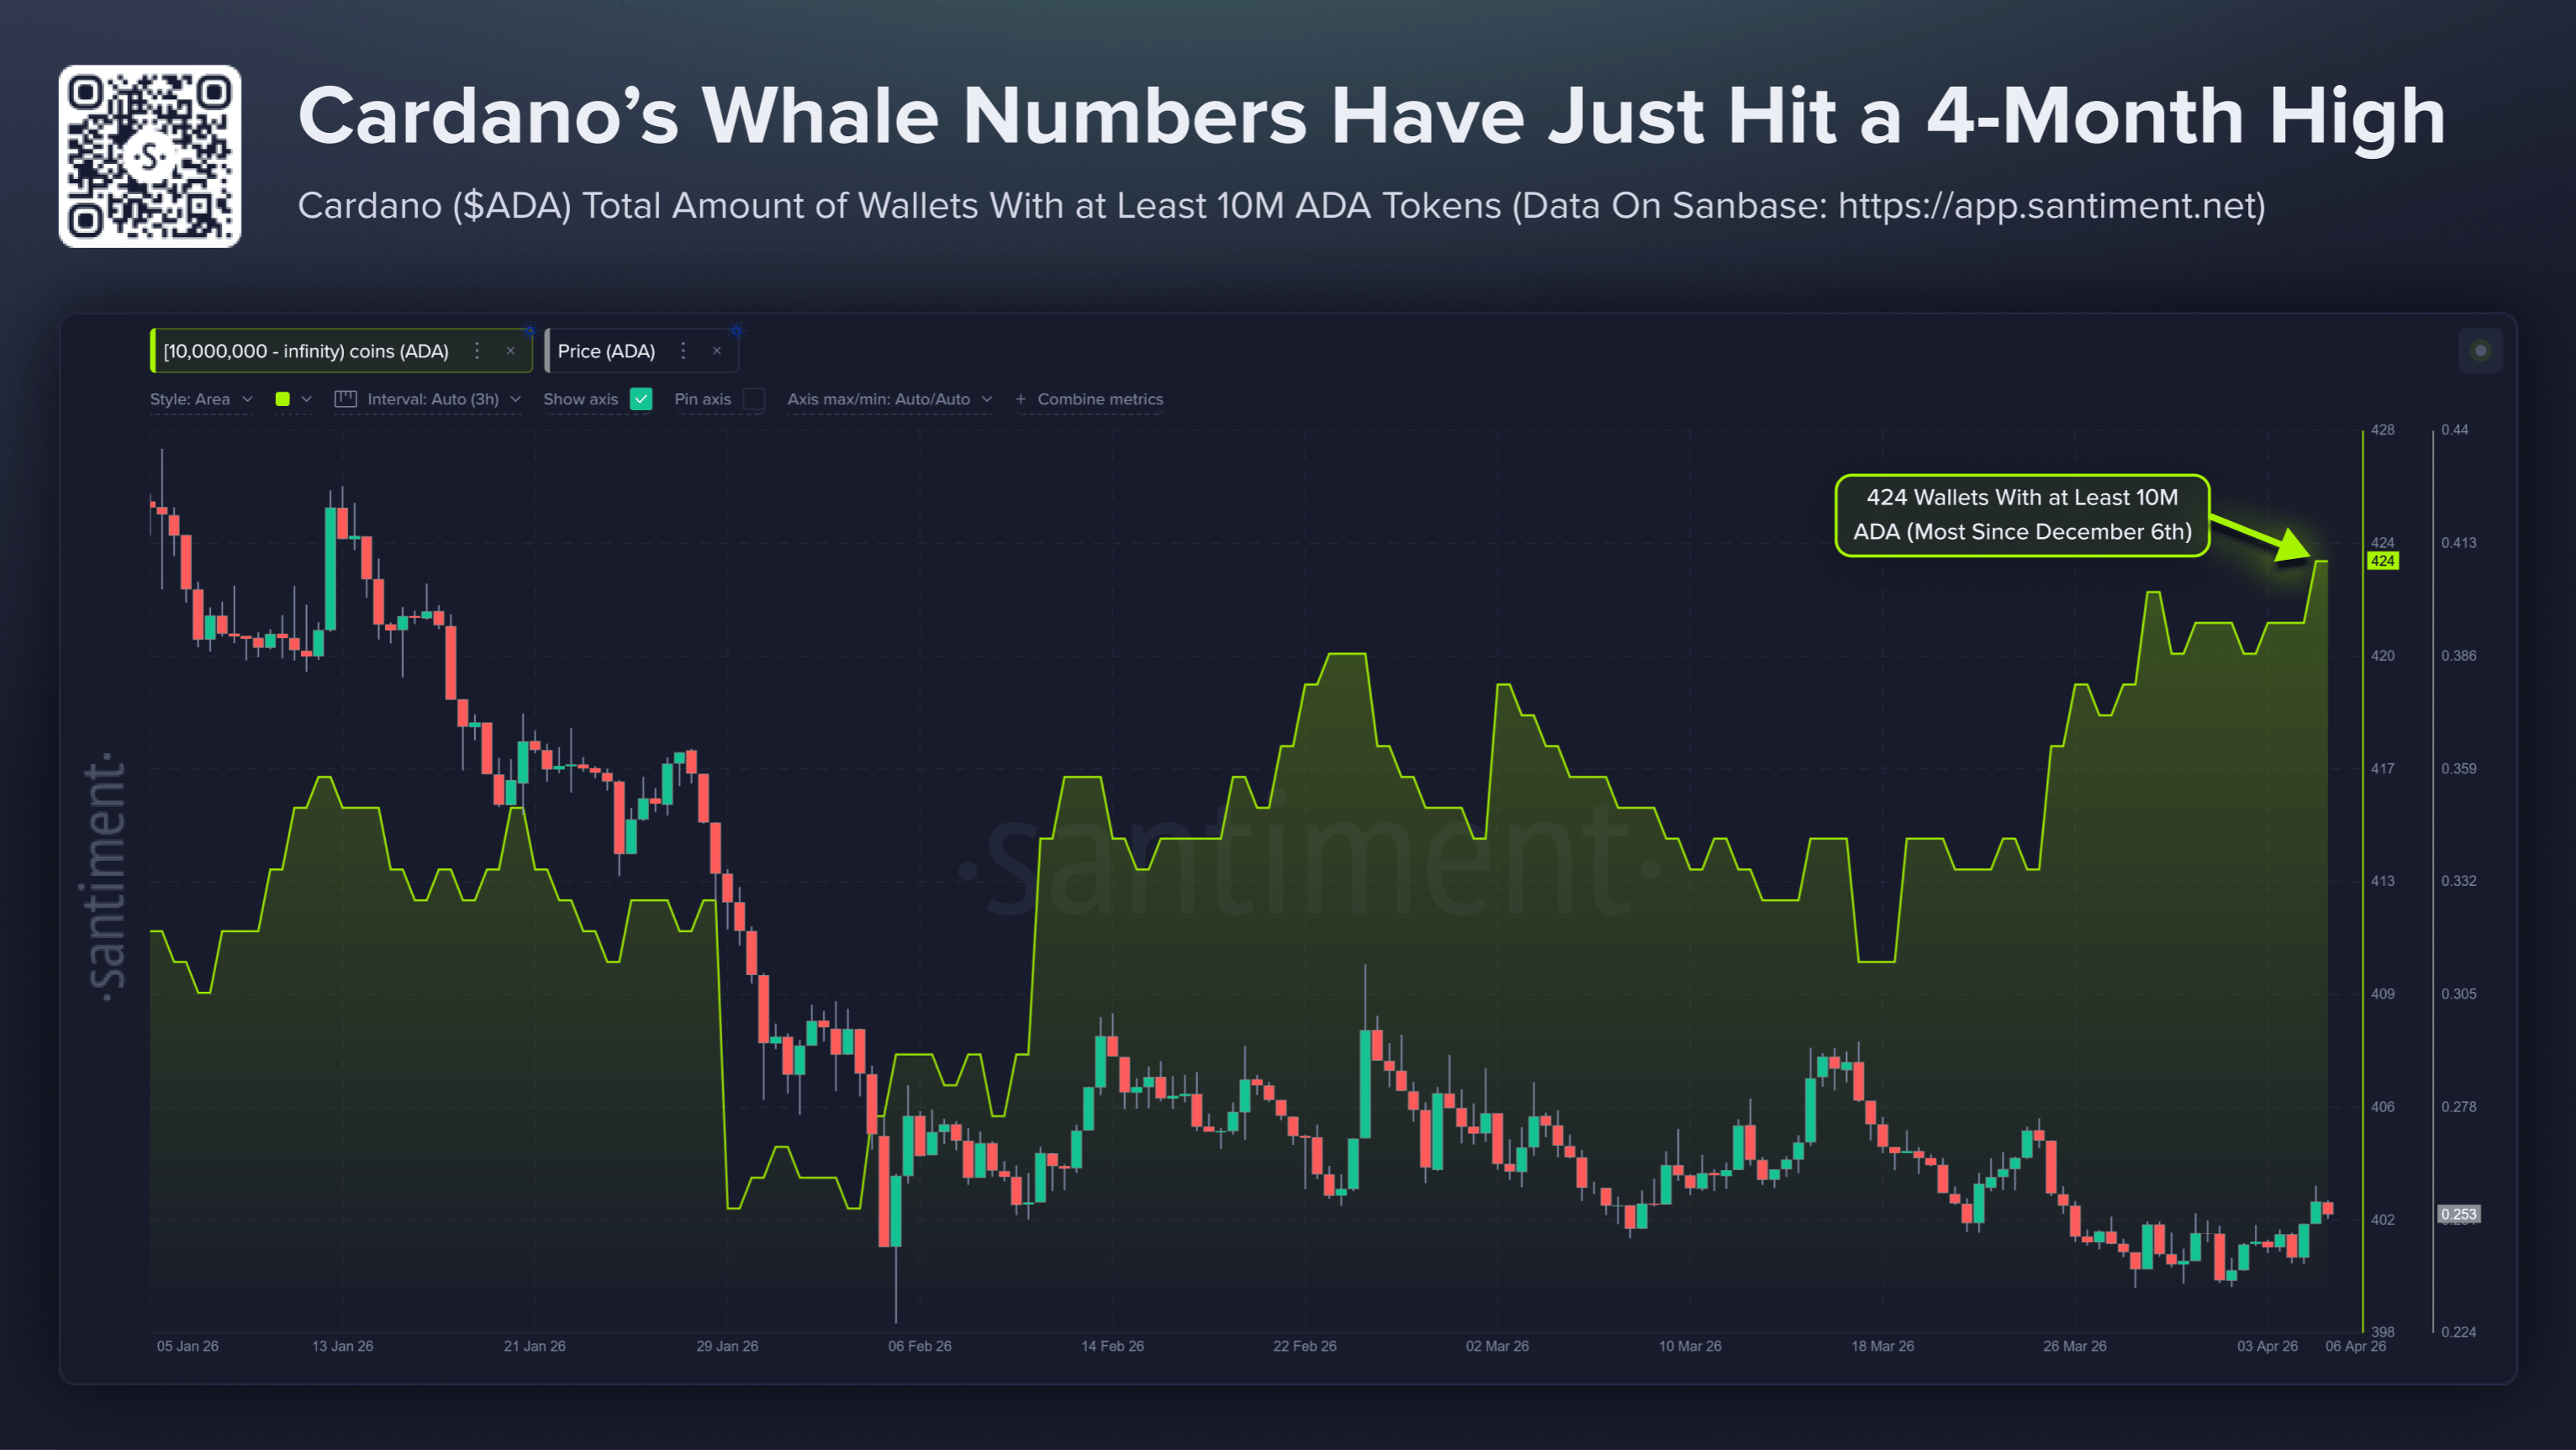
On the other hand, on-chain data shows that whales continue to expand their ADA holding, reflecting a long-term bet. Santiment data shows that the number of wallets holding over 10 million ADA tokens has reached a 4-month high of 424, up by over 5% in the last 9 weeks. Typically, an increase in whale holding during oversold conditions, as previously reported by FXStreet, suggests a potential rebound.
Will Cardano rise again?
Cardano shows a near-term mildly bearish bias as it trades well below the 50-day and 100-day Exponential Moving Averages (EMAs), keeping the broader downtrend intact. These downward-sloping resistance EMAs continue to cap the upside structure, with no evidence of a breakout.
The Moving Average Convergence Divergence (MACD) indicator has turned slightly positive near the zero line, while the Relative Strength Index (RSI) stabilizes around 44, which suggests only modest relief in momentum rather than a decisive shift in trend.
On the downside, immediate support sits at the March 29 low at $0.2328, with a drop through that level pointing to further weakness toward the February 5 low at $0.2205. As long as price trades below the 50-day EMA, rallies into resistance are vulnerable to renewed selling pressure.
If ADA reclaims the 50-day EMA at $0.2681, it would open the path toward the February 1 high at $0.2992.
(The technical analysis of this story was written with the help of an AI tool.)
Author

Vishal Dixit
FXStreet
Vishal Dixit holds a B.Sc. in Chemistry from Wilson College but found his true calling in the world of crypto.



