Cardano Elliott Wave technical analysis [Video]
![Cardano Elliott Wave technical analysis [Video]](https://editorial.fxstreet.com/images/Markets/Currencies/Cryptocurrencies/Coins/Cardano/Cardano_Coin_31.jpg)
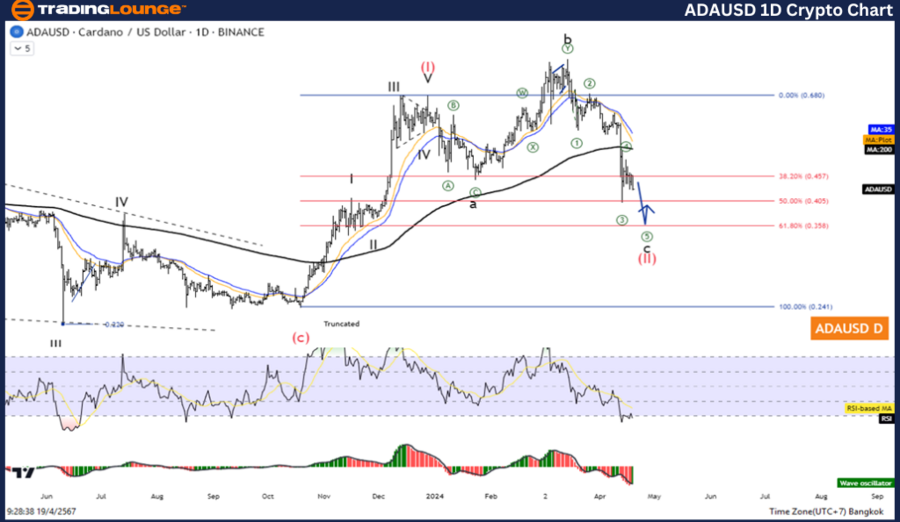
ADA/USD Elliott Wave technical analysis
Function: Counter Trend.
Mode: Corrective.
Structure: Flat.
Position: Wave C.
Direction next higher degrees: Wave (II) of Impulse.
Details: Wave II Is equal to 61.8% of Wave I at 0.358
Cardano/ U.S. dollar(ADAUSD)Trading Strategy: The second wave correction is likely to go down to test the 0.356 level before rising again in the third wave. Therefore, the overall picture is a short-term pullback to continue rising. Wait for the correction to complete to rejoin the trend.
Cardano/ U.S. dollar(ADAUSD)Technical Indicators: The price is above the MA200 indicating a Downtrend, The Wave Oscillator is a Bearish Momentum.
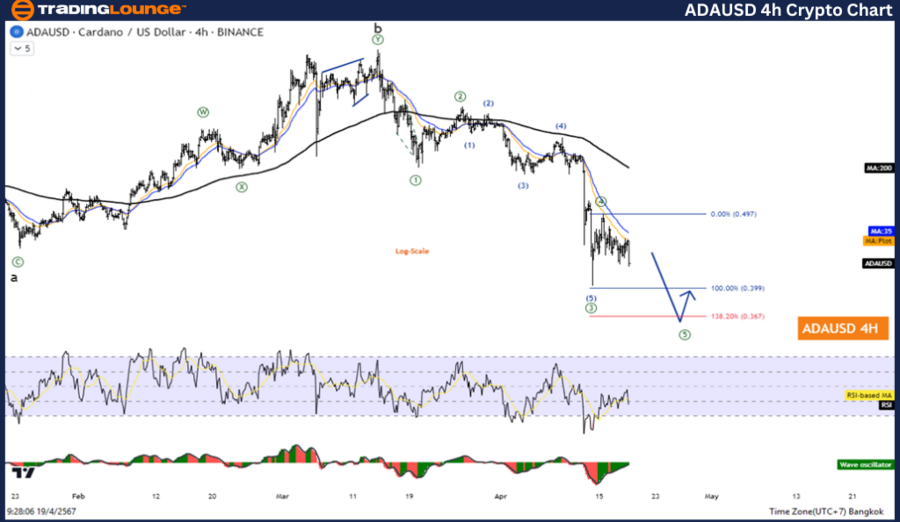
ADA/USD Elliott Wave technical analysis
Function: Follow Trend
Mode: Motive
Structure: Impulse
Position: Wave 5
Direction next higher degrees: Wave ((C)) of Zigzag
Wave cancel invalid Level: 81.238
Details: The Five-Wave Decline of Wave ((C)) trend to test 11.582 Level
Cardano/ U.S. dollar(ADAUSD)Trading Strategy: The second wave correction is likely to go down to test the 0.356 level before rising again in the third wave. Therefore, the overall picture is a short-term pullback to continue rising. Wait for the correction to complete to rejoin the trend.
Cardano/ U.S. dollar(ADAUSD)Technical Indicators: The price is above the MA200 indicating a Downtrend, The Wave Oscillator is a Bearish Momentum.
Cardano Elliott Wave technical analysis [Video]
Author

Peter Mathers
TradingLounge
Peter Mathers started actively trading in 1982. He began his career at Hoei and Shoin, a Japanese futures trading company.


