Bitcoin Technical Analysis: BTC/USD explosive breakout remains eyed
- Bitcoin price on Monday was seen trading in very minor positive territory, by just 0.05%. Lack of commitment is still an issue for the market.
- BTC/USD continues to trade within the mundane range, which has been seen for 11 sessions now.

BTC/USD 15-minute chart
- Price action has formed a bearish flag pattern, after the fall on Sunday.
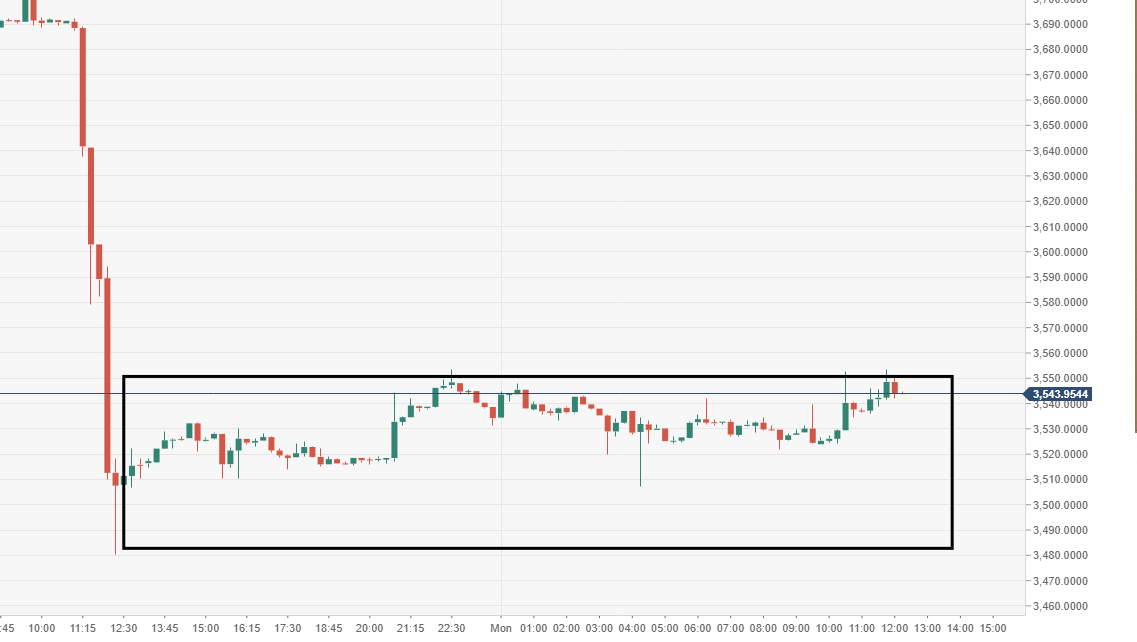
Spot rate: 3544.42
Relative change: +0.05%
High: 3553.47
Low: 3507.32
Trend: Bearish
Support 1: 3442.30, daily pivot point support.
Support 2: 3350.33, daily pivot point support.
Support 3: 3220.13, daily pivot point support.
Resistance 1: 3664.46, daily pivot point resistance.
Resistance 2: 3794.66, daily pivot point resistance.
Resistance 3: 3886.63, daily pivot point resistance.
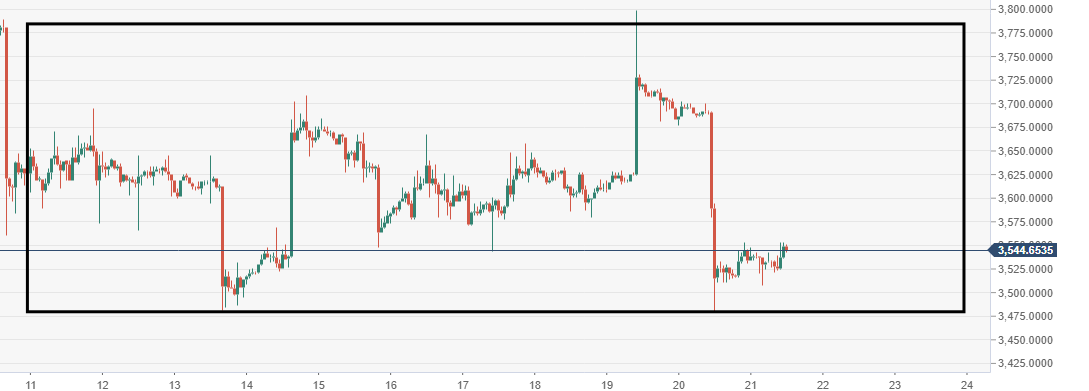
BTC/USD 60-minute chart
- Price moving within the range-block formation, buying comes into play at $3500-4000 area, resistance at $3700-800.
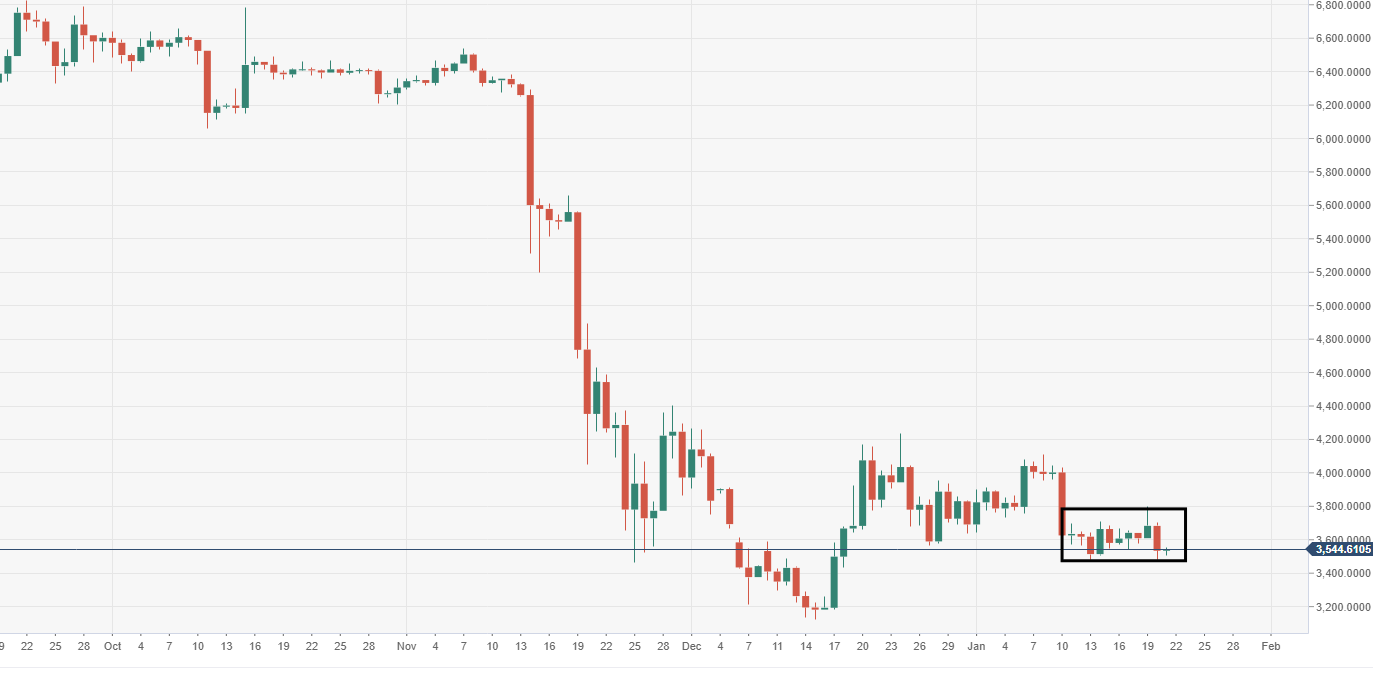
BTC/USD daily chart
- Price action stuck within lifeless range, seen for 11 sessions now.
Author

Ken Chigbo
Independent Analyst
Ken has over 8 years exposure to the financial markets. He started his career as an analyst, covering a variety of asset classes; forex, fixed income, commodities and equities.


