|

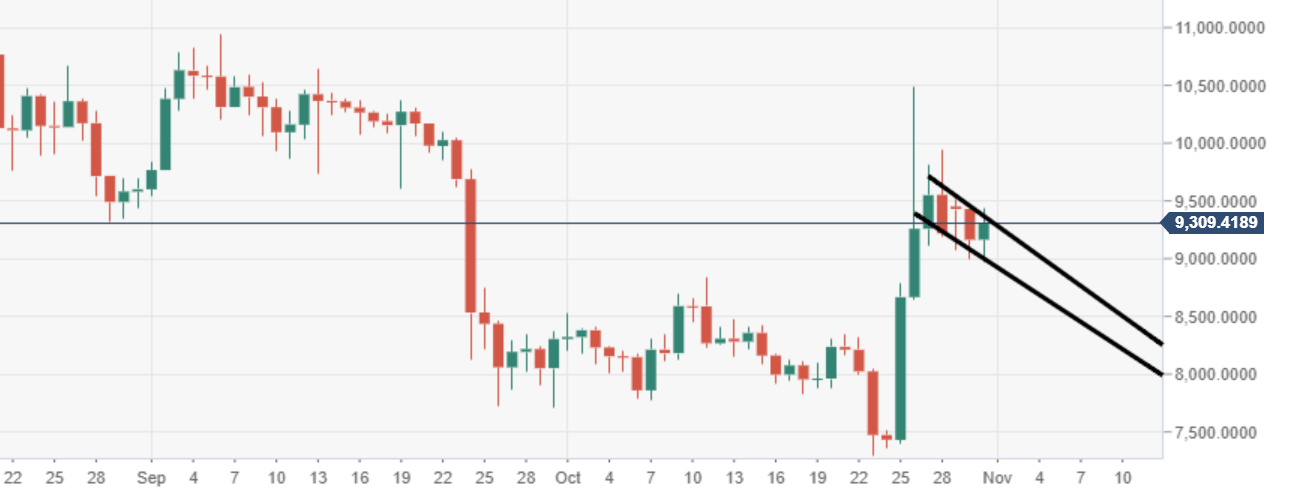
Bitcoin technical analysis: BTC/USD daily price action nearing a potential breakout

  • Bitcoin price is trading in the positive territory, down some 1.60% in the second half of the session. 
  • BTC/USD is moving within a bullish flag formation as the price consolidates, following a decent break higher last week. 
  • Critical resistance eyed at $9500, a breakdown here could provide a fresh wave to buying pressure. 

BTC/USD daily chart

BTC/USD price action via the daily chart view is moving within a potentially bullish flag structure. 

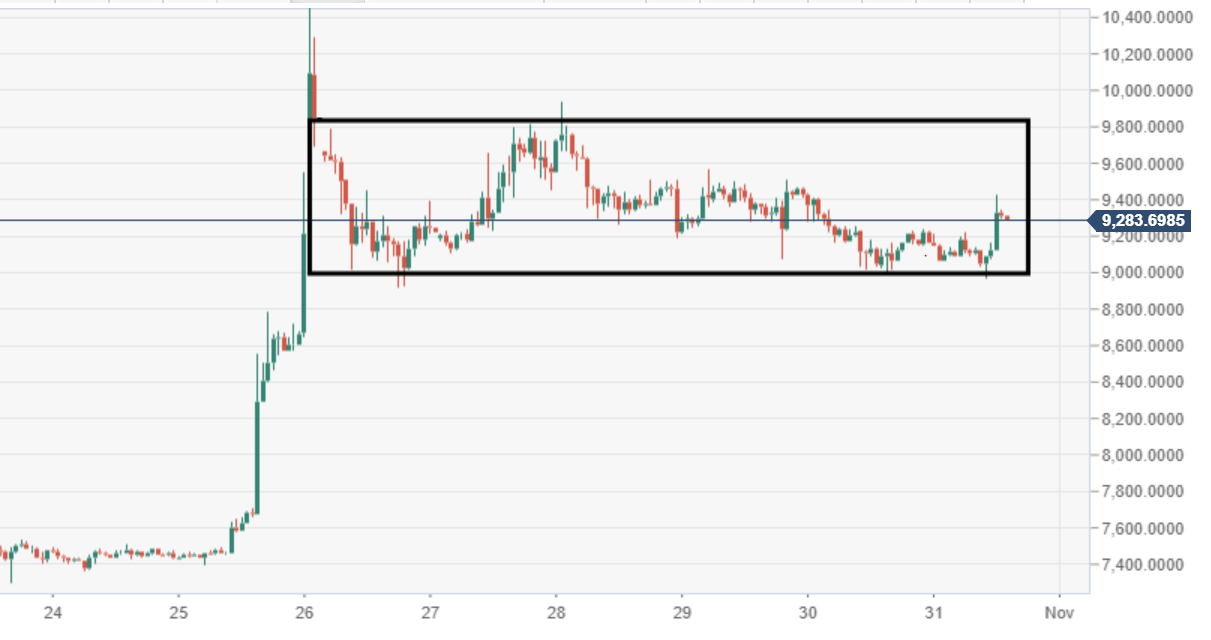
BTC/USD 60-minute chart

Price action via the 60-minute chart view is moving within a narrowing range block, subject to a potential breakout. 

Spot rate:                  9,311.28

Relative change:      +1.60%

High:                          9,431.19

Low:                           8,964.78

Author

Ken Chigbo

Ken Chigbo

Independent Analyst

Ken has over 8 years exposure to the financial markets. He started his career as an analyst, covering a variety of asset classes; forex, fixed income, commodities and equities.

More from Ken Chigbo
Share:

Editor's Picks

Crypto's future lies in tokenized real-world assets, not speculation

Atlas Capital CEO Reza Bandi stated that the crypto industry's next major growth phase will be driven by the tokenization of real-world assets rather than speculative trading. In an interview with FXStreet, Bandi identified three factors supporting the expansion of tokenization.

Top 3 Price Prediction: BTC remains vulnerable, ETH weakens further, XRP signals more downside

Bitcoin, Ethereum, and Ripple remain under pressure mid-week, as the broader cryptocurrency market struggles to regain recovery momentum. BTC struggles below $62,000, ETH continues to weaken below $1,650, while XRP’s momentum indicators remain biased toward further downside.

Crypto Overview: Bitcoin is back under $62,000 – Hyperliquid, DeXe lead losses

The broader cryptocurrency market is under pressure with Bitcoin slipping below $62,000 amid the US launching its third wave of strikes on Iran. Hyperliquid and DeXe are leading losses over the last 24 hours, risking the prevailing upward trend.

Bitcoin sell-off pushes over 50% of circulating supply into loss, hinting at market bottom
Bitcoin (BTC) dropped near $61,000 on Tuesday, with the latest sell-off pushing long-term market indicators toward levels historically associated with bear-market bottoms, according to a report by K33 Research.
Bitcoin: After the bloodbath, everyone looks at $60,000
Bitcoin (BTC) hovers above $62,000 at the time of writing on Friday, weighed down by growing risk-off sentiment due to persistent geopolitical tensions in the Middle East and sticky macroeconomic uncertainty. The institutional sell-off continued to wreak havoc on capital flows, with spot Bitcoin Exchange-Traded Funds (ETFs) recording billions in outflows.