Bitcoin technical analysis: BTC/USD consolidating ahead of a potential explosive out
- Bitcoin price is trading in positive territory, down some 0.30% in the second half of the session.
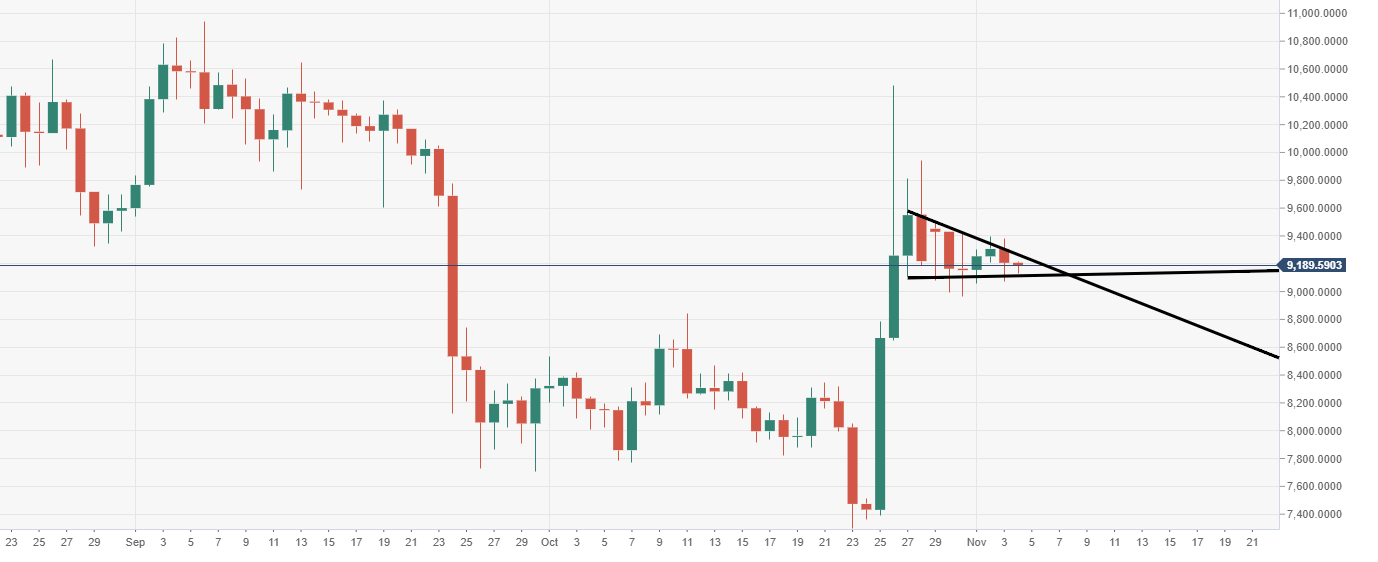
- BTC/USD price action is moving within a narrowing pennant structure, subject to a breakout.
- Big resistance barrier should be noted at $9500, a breakdown here could provide a fresh wave to buying pressure.

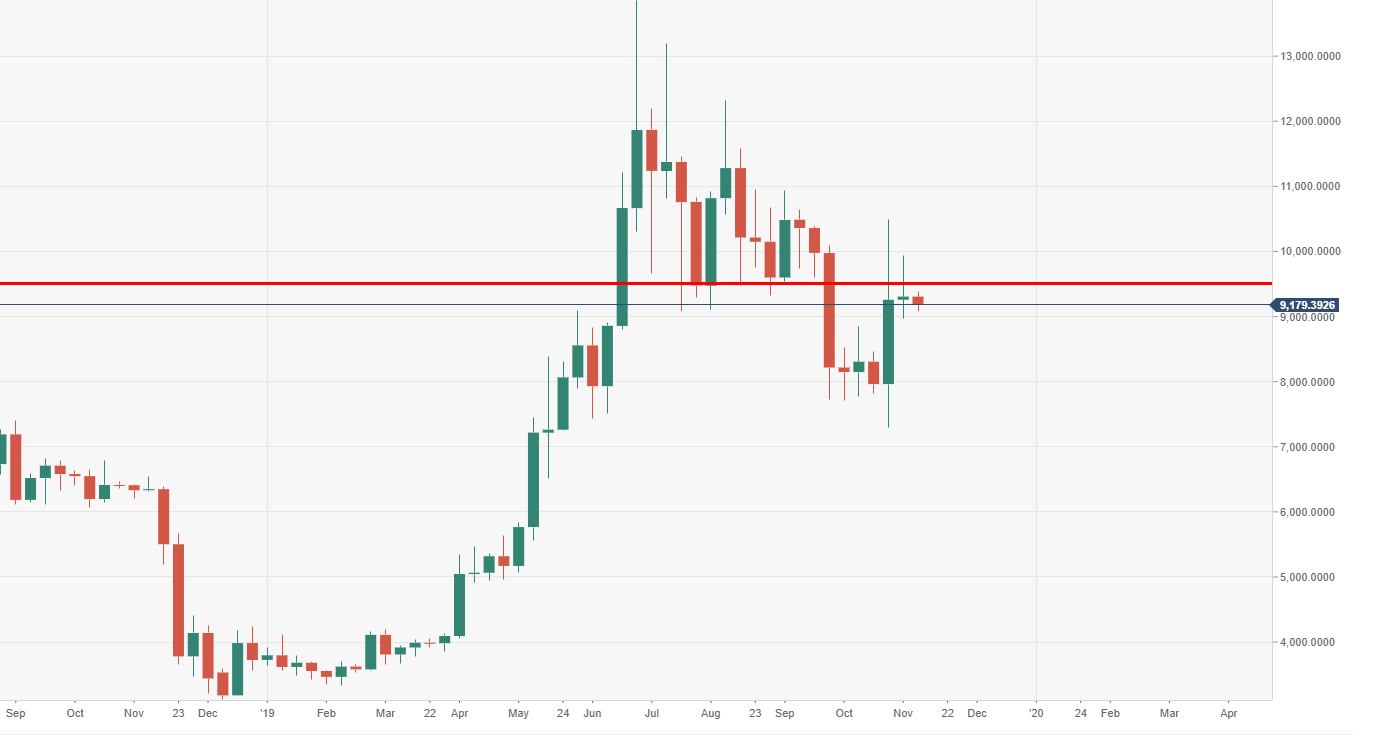
BTC/USD weekly chart
Large weekly resistance can be observed at $9500, the gateway to further upside.
BTC/USD daily chart
BTC/USD price action via the daily chart view is moving within a bullish pennant, which has been the case since 27 October.
Spot rate: 9,122.02
Relative change: +0.40%
High: 9,217.43
Low: 9,127.40
Author

Ken Chigbo
Independent Analyst
Ken has over 8 years exposure to the financial markets. He started his career as an analyst, covering a variety of asset classes; forex, fixed income, commodities and equities.
More from Ken Chigbo


