Bitcoin Price Analysis: BTC/USD daily candle presents a risk of reversal
- Bitcoin price is trading in the red, down some 1.45% in the second half of the session.
- BTC/USD daily candle of Wednesday has formed a Doji, indicating a potential reversal.
- The next major barrier of support is eyed down at the $8500 price mark.

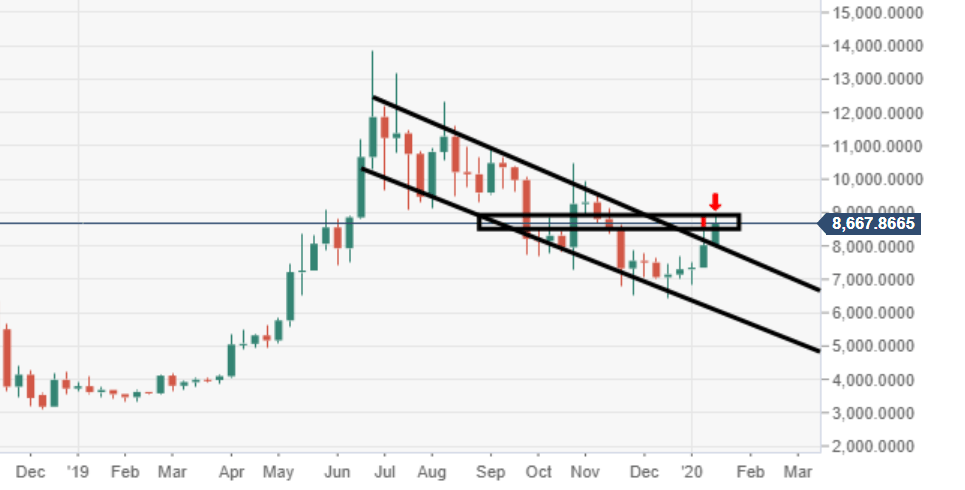
BTC/USD weekly chart
Price action is extending to the upside and remains bullish via the weekly view, given the breakout of the bull flag pattern.
BTC/USD daily chart
Sellers kicked in ahead of the psychological $9000 price territory, as the daily forms a potential reversal candlestick.
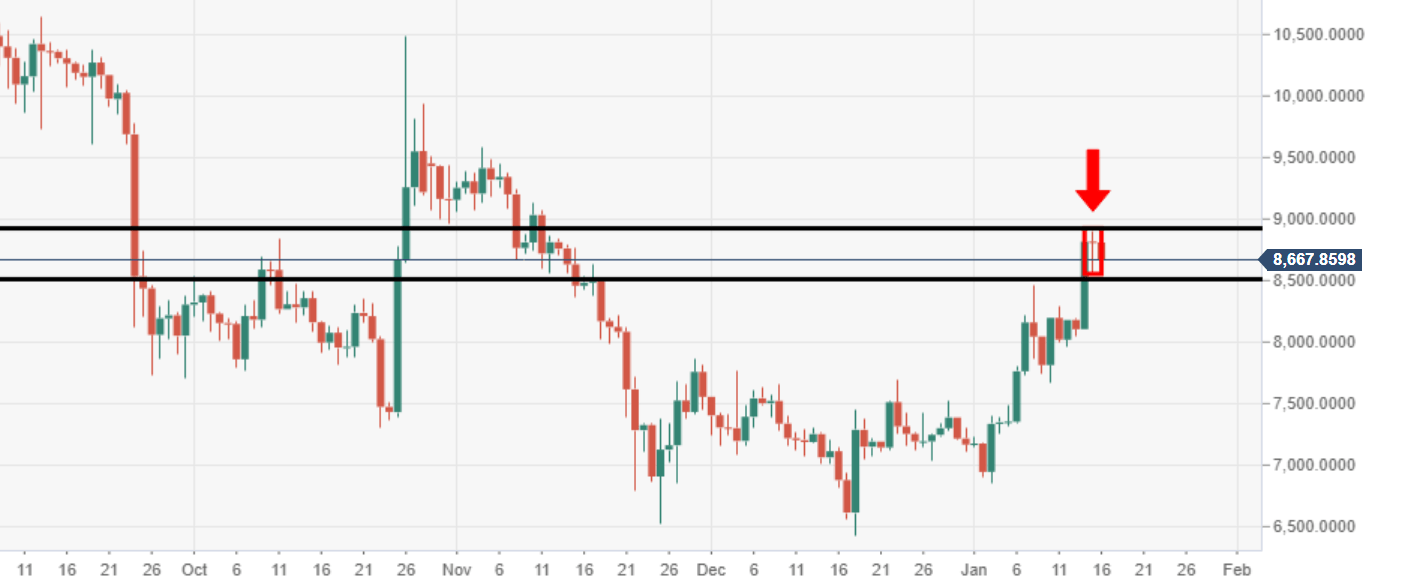
Spot rate: 8681.50
Relative change: -1.45%
High: 8848.81
Low: 8580.85
Author

Ken Chigbo
Independent Analyst
Ken has over 8 years exposure to the financial markets. He started his career as an analyst, covering a variety of asset classes; forex, fixed income, commodities and equities.
More from Ken Chigbo


