Bitcoin lags global liquidity at record highs: Will it catch up?
- Bitcoin trades near $66,000 as easing US-Iran tensions lift stocks and crypto.
- Analysts Alphractal and Martini Guy flag the widest liquidity divergence this cycle.
- Glassnode data shows stabilization, not a confirmed reversal, in Bitcoin's price.

Bitcoin (BTC) is trading roughly 48% below its October peak even as global money supply sets a record, opening a key gap between the asset and global liquidity this cycle.
The divergence has drawn attention from market analysts who treat liquidity as a leading signal for risk assets. Their core question is whether Bitcoin breaks or continues a long-standing pattern.
Bitcoin and global liquidity are diverging
Alphractal noted that the global M2 money supply, a common proxy for worldwide liquidity, recently reached a record of nearly $135 trillion. The S&P 500 has tracked that expansion, trading near its own record highs.
Bitcoin historically follows the same liquidity wave, though with higher volatility and a longer lag. That relationship held through 2024 and into early 2025 before it broke down.
“Since early 2025, BTC has diverged sharply: while M2 continued making new highs and SPX recovered to near-ATH, BTC has compressed,” the firm mentioned.
Alphractal called the current divergence the most pronounced in its dataset and described two ways to read it.
The first is the convergence reading. It holds that an asset this far below liquidity has typically closed the gap through price gains. That recovery comes from appreciation rather than shrinking liquidity.
The second is the structural reading. It treats the Bitcoin-liquidity link as non-mechanical rather than fixed. Past divergences in 2018 and 2022 were resolved over 6 to 18 months. The correlation can also weaken as the holder base changes.
“Which reading applies depends on whether the current divergence reflects a temporary dislocation or a structural shift in BTC's correlation regime,” Alphractal said.
Analyst Martini Guy framed it the same way. He said the macro backdrop is improving, while Bitcoin has not yet reflected it. Either Bitcoin starts closing the gap, or its tie to liquidity breaks in a way “we haven't seen for quite some time.”
Can Bitcoin catch up to liquidity?
Meanwhile, Bitcoin firmed toward $66,000 this week as the US-Iran deal lifted equities and risk assets. At press time, the asset traded at $65,831, up 0.27% over the past day.
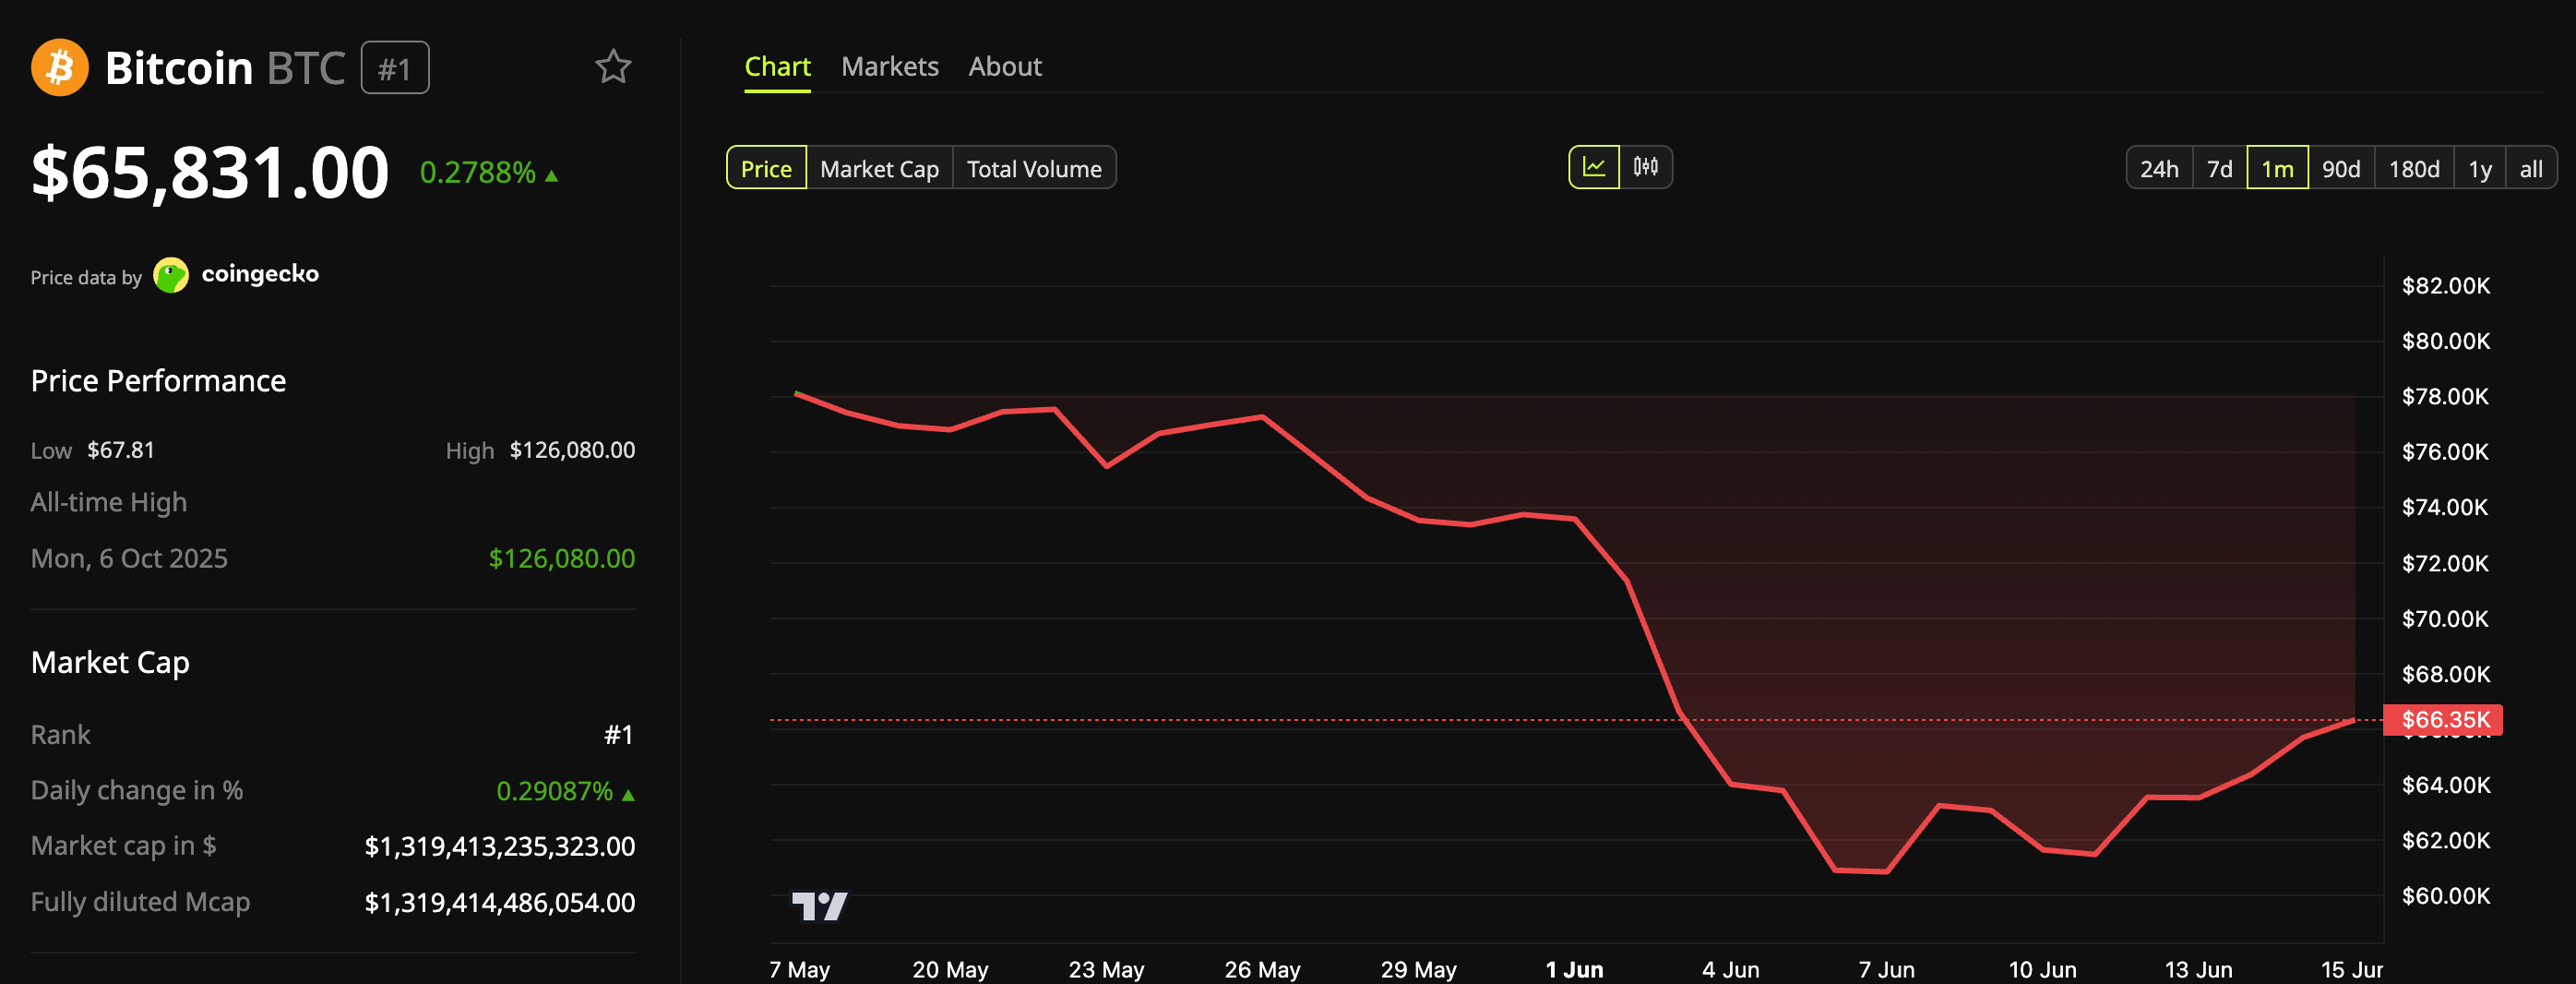
Bitcoin (BTC) Price Performance. Source: BeInCrypto Markets
The bounce strengthens the stabilization signal but does not confirm a trend change. On-chain data supports that reading.
Glassnode described the recent move up from near $60,000 as base-building rather than a confirmed reversal.
“The recovery is happening on thin ice. Spot volume collapsed 40.4% to $5.8B and Futures Open Interest declined another 3% to $30.6B, a sign the bounce is being driven by covering rather than fresh conviction. Long-side funding payments fell 22.3% and ETF trade volume dropped 38.1% to $11.1B. The market is lighter, not healthier,” the report read.
The macro backdrop favors a recovery, but Bitcoin has not confirmed one. The coming weeks of flow and volume data should show which reading holds.
Author

BeInCrypto
BeInCrypto
Since 2018, BeInCrypto has grown into a leading global crypto news platform. Through our award-winning journalism and close ties with industry leaders, we deliver trusted insights into Web3, AI, and digital assets.




