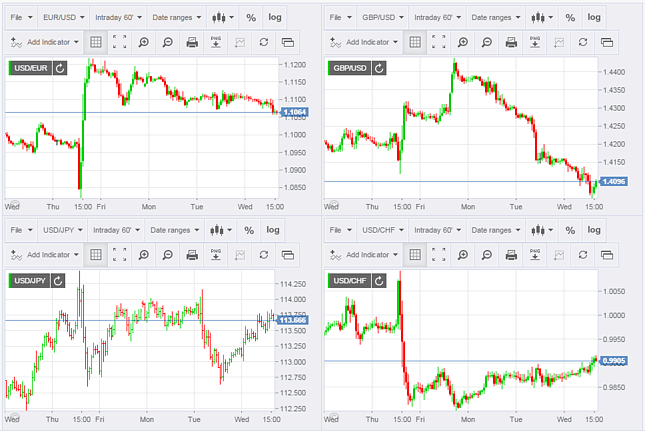
Live Forex Charts
The Forex Charts offer over 6,000 graphs in real-time with Forex Interbank rates, Cryptocurrencies, Commodities, Equity Indices and US stocks. It includes 19 time frames and flexible line tools. It also presents a vast range of technical indicators (over 100) such as Linear Regression, CCI, ADX, the FXStreet Fed Sentiment Index, and many more. You can detach the graph and see it full-screen. Make the most of our chart.
Currency Analysis
Currency News
Forex Chart Station
Currency Education
FEATURES AND BENEFITS
An absolutely must-use tool for the trader, FXStreet’s Interactive chart offers a very professional platform
- fully customizable
- web-based (no installation needed)
- updated in real-time (tick-by-tick)
- totally free of charge - and it will stay like this
and offers you
- over 6,000 assets (including all Forex pairs, Cryptocurrencies, Commodities, Indices and US stocks)
- unique interbank rates
- extensive historic data
- over 100 technical indicators, including the FXStreet Fed Sentiment Index
- the option to save your configuration
Here below you have a complete description of its most interesting features and benefits so you can make the most of it.
UNIQUE INTERBANK RATES
The majority of other information websites display prices from a single source, most of the time from one retail broker-dealer.
At FXStreet, traders get interbank rates coming from a systematic selection of data providers that deliver millions of updates per day.
Interbank quotes are essential for realistic valuations, such as comparison between interbank and a particular broker-dealer's rates; calculating risk exposure; analyzing performance; and justifying trades since price-driven indicators are much more reliable when using interbank rates.
Our rates are provided by Teletrader,
a worldwide financial information provider to institutions like banks, brokers and stock exchanges.
FXSTREET FED SENTIMENT INDEX
There are many factors that impact asset valuations, such as macroeconomic data releases, geopolitical developments, and political headlines. Nevertheless, one of the arguably most closely watched market drivers is Fedspeak – a form of forward guidance that contains official and alternative communications by the Federal Reserve (Fed) officials.
In our commitment to finding actionable insights to help retail traders in their journey, FXStreet is introducing a new tool to help solve this difficult exercise: the FXStreet Fed Sentiment Index indicator.
FXStreet Fed Sentiment Index indicator presents the Fed’s tone as a single value, considering comments from all voting and non-voting members of the FOMC in TV appearances, conferences, interviews, as well as the Fed’s official written communications and more.
The FXStreet Fed Sentiment Index indicator is adjusted every time a Fed policymaker comments on the policy outlook. It aims to explain how markets perceive the Fed language in its totality over a longer period of time.
You will be surprised by all it has to offer.
CONTENT INDEX
1. CHART FEATURES
1.1. Over 6,000 assets
You can choose between 6,000 different assets: all Forex crosses (and their reverse too - see below), but also cryptocurrencies, main commodities, indices and US stocks. You can also directly type the asset in the search asset field. Note that you must put a slash between the two currencies of the pair. For example: USD/JPY and not USDJPY.
Reverse crosses
We all know EUR/USD... But do you know USD/EUR? "It does not exist" would be the first answer. Wrong! All currency crosses exist in both directions... And they are available on our interactive graph!
1.2. Time frames: 19 predefined options
You can display the asset rates in 19 different time frames: Intraday (16 time frames available, from 1 to 720 minutes - that is 12 hours), Daily, Weekly, and Monthly.
1.3. Extensive historical data
On our forex charts, you can display historical data of 250 periods (250 minutes, hours or days), a valuable data you get for free here! You can use this history to make price behavior studies. How to show more historical data? Use the zoom-out option.
1.4. Over 100 technical indicators
You can add up to 100 technical indicators to your graph, such as Linear Regression, CCI, ADX, and many
more.
In our commitment to helping traders in their journey, FXStreet is introducing a new tool for this challenging exercise: the FXStreet Fed Sentiment Index indicator.
2. FOREX CHART TYPES
You can choose among 12 graph types:
Time-related construction charts
Line, Candlestick, Bar (OHLC), Bar (HLC), Mountain, Histogram, Heikin Ashi, Points and Stair Steps.
2.1. Unique Types
Heikin Ashi
Heikin Ashi graph helps you detect trends - a feature you will only find on professional platforms. The Heikin-Ashi technique helps you identify a trend more easily and detect trading opportunities. Also you can use our Forecast Poll. It’s a tool you can use to improve the isolation of trends (cancelling noise on the graph) and predict future prices. This forex plot type is not considered to be valid to take positions but rather to perform a follow-up of your trading positions.
3. DRAWING TOOLS
You have plenty of options to draw on your graph, from lines (including trend channels) to arrows, going through rectangles, circles and much more. Quick option to select where you want your lines to be placed (High, Low, Open or Close). You can also write any text you want to add your particular notes and comments. Another available option to benefit from is the one that allows to configure the color of each of the drawings you put on the board, as well as the line weight (thin, regular or bold).
3.1. Exclusive drawing tools
Andrew Pitchfork
Establish profitable opportunities and swing possibilities with it. It’s a technical drawing tool that uses three parallel trendlines to identify of support and resistance levels. It can help you define the price’s future movement range and its medium point.
Fibonacci Retracements and Arcs
Map out the magnitude of price moves with Retracements and Arcs. These tools let you draw studies about the possible developments of a price based on its previous move. It can be calculated following different mathematical concepts (Fibonacci, Gann…). While retracements are concerned with just the magnitude of moves, Arcs factor both magnitude and time, offering areas of future support or resistance that will move as time progresses.
Linear Regression lines
Determine trend direction with Linear Regression lines, wich analyze two separate variables, price and time, to define a single relationship and predict price trends.
4. ADVANCED USE
4.1. Compare assets
We offer a tool to compare graphs so you can analyze the price history of two assets and analyze relative performance over a period of time. When you click on “Compare”, you can choose the second asset (currency, equity or index). The graph of both assets will be displayed in the same table, with the percentage of deviation in the right vertical axis. The starting point of both lines is zero. For a clearer view, it’s recommended to choose the “line” type. You can edit the color and weight of each currency.
5. SAVE, DETACH AND EXPORT
5.1. Save your configuration
Once you have customized all the options you need to analyze and trade the asset, you can save it. So when you come back to the board, it’s ready for you to work on!
5.2. Detach and see it full-screen
By clicking on the “Full chart” button, you will detach it from the FXStreet page so you only see and can focus fully on the diagram (no lateral bars, no navigation menu at the top).
5.3. Export images
In just one click, you can export and save images (.png) of your graphs (with all your indicators, lines, drawings,...) for later analysis and review. Search for the “PNG” icon.
| EUR/USD Chart | GBP/USD Chart | USD/JPY Chart | AUD/USD Chart |
| USD/CAD Chart | GBP/JPY Chart | NZD/USD Chart | EUR/JPY Chart |