![]() FXStreet Expert Contributor
FXStreet Expert Contributor
FXStreet
Global financial markets maintain close relationships as international trade and commerce help bring us together in one world economy. Just as the effects of the strengthening economy in Brazil can be seen in Argentina, the effects of a credit downgrade in Greece or Ireland can be felt in the US. Within one nation, these inter-market relationships are especially important.
Stocks & Bonds: On a day to day basis, investors constantly make the same decision; stocks or bonds? Each and every investor evaluates market and economic conditions, and places their capital in the investment vehicle that appears to offer the best return for the risk taken, ultimately driven by the two most powerful emotions; fear and greed. When times are good with high levels of employment, strong corporate earnings, and rising consumer prices, stocks tend to rise. Monies are withdrawn from savings accounts with the hopes of capturing superior returns as innovation leads equity markets to new lofty heights. Bonds fall out of favor and are forced to offer higher yields in order to compete with the euphoric effects of new 52-week highs only stocks can provide. In the glorious days of 2007’ as the Dow (Dow Jones Industrial Average) approached 14,000 the U.S. 10-year treasury bonds offered yields in excess of 5.00%.
Conversely as stock prices suffered extensive losses reaching multi-decade lows in 2008’, feelings of greed quickly shifted to fear as the Dow touched lows below 7,000, the 10-year bond yields sank to levels nearly touching the 2.00% threshold. As bond yields rise, the actual price of the bond falls as the cost to pay this yield makes the bond less valuable, which is demonstrated in the following example: An investor purchases a Treasury bond offering a 3% yield, issued at $1,000 parity. The economy, stocks, and bond (yields) subsequently rise. New bond issues that now offer 5%, make those 3% bonds less attractive and therefore less valuable in the eyes of the investor.
Stocks & the Dollar: The USD and Dow have enjoyed positive and negative correlations, at times moving in the same or opposite directions. Over the past few years under a low interest rate environment an opposite or negative correlation has persisted. As the USD tends to move under the anticipation of higher or lower interest rates, positive economic data leads the ‘market’ to believe the FED (Federal Reserve) is more likely to raise interest rates, and it is therefore logical to expect USD strength. The opposite also holds true; negative economic data may lead investors to believe the FED is less likely to raise rates or perhaps even lower borrowing costs which in turn may result in a weaker USD.
However as interest rates are lowered to stimulate the economy, any (economic) news event that implies the FED is less likely to raise interest rates will ultimately benefit businesses as lower borrowing costs make it easier (less expensive) to borrow and invest capital as this climate also encourages consumers to return to the housing market, seek out financing, and put money to work within the economy. Furthermore, low rates make savings accounts and fixed income products (that typically move with interest rates) less attractive, all of which ultimately benefits corporate earnings and their respective stock prices, as investment capital finds its way into more speculative vehicles such as stocks, real estate, (commodities at times), and innovative start-up businesses.
With that said, this opposite relationship between the DOW and USD did not always exist. In the years past under high interest rates, stock prices and the USD did enjoy a positive correlation as foreign investment capital that finds its way into US businesses, US stocks, and ultimately the USD. Therefore when searching for the relationship between stock prices and their respective currency (in this case the USD), it is important to make note of the current interest rate environment.
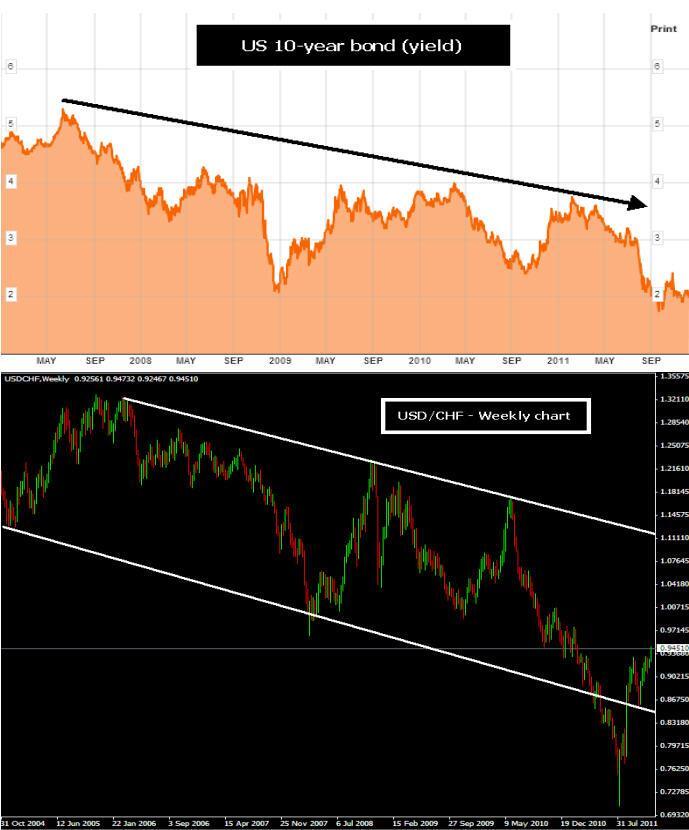
USD & 10-year Gov’t Bond: The bond market possibly enjoys the closest relationship with its respective currency as both are closely linked to current interest rates. During prosperous economic conditions as consumer prices rise, the probability of the Fed raising interest rates also increases. To compete with rising stock prices the bond market (in order to stay competitive) will also offer higher yields. The following chart illustrates that despite a long-term trend to the downside, the USD (USD/CHF) behaves in similar fashion to the 10-year (US Treasury) bond market. At the height of the economic boom in 2007’, the 10-year bond offered yields in excess of 5.00% while the USD/CHF tested levels above 1.30. As stock prices reached their ultimate bottoms in the latter days of 2008’, the 10-year bond yields touched lows near 2.00% as the USD/CHF also reached the bottom of its near-term cycle dropping to levels near 2.50. Ultimately both the bond market (yield) and the USD move in anticipation of higher / lower interest rates, watching fundamental data, searching for signs of a change in economic conditions.
Yet much has been said about the precipitous decline the USD has suffered over the course of the past few years, which actually is part of a much longer-term trend lower. This steady and long-lasting decline can be attributed to a number of macro-economic factors such as the amount of additional dollars that have been printed and injected into the U.S. economy, ultimately diluting the value of the USD against its major trading counterparts. In turn a weakening USD has contributed to the broad-base rise in commodity prices, as we simply require more USD’s to purchase a barrel of crude oil and ounce of gold. Nevertheless within the long-term USD trend to the downside, the shorter-term relationship between the USD and bond market remains.
10yr, 30yr, & bond spread: The bond market can also provide additional insight as we compare the behavior of different maturity issues over the same period of time. A longer-maturity bond (such as the 30-yr) will naturally pay a slightly higher yield as theoretically speaking, the investor is purchasing that bond for a greater period of time, and under normal circumstances we would expect better economic conditions as we look further into the future. For example in the latter part of 2009’, the 30-year U.S. Treasury bond offered a yield of approximately 4.20% while its 10-yr counterpart offered yields of approximately 3.20%. The ‘spread’ (difference between the two yields) at that time remained around 1.00%, or 100-basis points. (100 basis points = 1.00%). This ‘normal yield curve’ typically exists as investors expect the economy to continue to grow over time, and expect the economy to better in future than it is now. However at times the 10-year (yield) will decrease at a faster rate than the 30-year (yield) which indicates a bleak near-term expectation of economic conditions yet still forecasting better conditions looking further out into the future.
There is enough text and analysis on ‘yield curves’ to fill entire libraries, however even at the most simplified level it is important to understand the behavior of similar bonds with different maturities. As we will typically expect bonds with longer-maturities (30-yr bonds) to offer higher yields than shorter-term bonds (10-yr), at times this relationship can be inverted. In fact an ‘inverted yield curve’ exists when the shorter-term bond actually offers a higher yield than the longer-term, and has been considered a signal of a future economic recession. Notice on the following chart how the 10-year bond actually offered a slightly higher yield than the 30-year in early 2006’; which gave us an early sign of what lay ahead.
As we typically expect longer-term maturity bonds to offer higher yields than short-term bonds, at times both maturities will offer very similar yields. This can be considered a sign of future economic transition. Notice in late 2007’ & late 2008’ the ‘Spread’ (difference between 10 & 30 year bonds) fell (near zero) indicating both bonds offered a very similar yield, and occurred before massive changes in the economy and ultimately stock market prices, first to the downside, and then higher.
Looking forward: It is of course impossible to know for sure what will happen in the future, and two investors can look at the same chart and come to very different conclusions, buy we can still make educated guesses based on how financial markets have behaved in the past. Comparing the Dow & 10-year bond (1st chart) we can see quite a divergence between the two markets. Based on the premise that both lines typically move fairly close together, we may come to the conclusion that either the Dow will move lower, or the 10-year bond (yields) will increase (or both will occur), as both lines once again draw closer together. If the 10-year bond yields appreciate this ‘may’ be the result of improving economic conditions, as a declining Dow ‘may’ forecast the expectation of lower corporate earnings.
Furthermore the (2nd chart) shows the negative correlation between the Dow and USD. If we expect stock prices to move lower, this would most likely occur alongside a strengthening USD. Again, as the USD currently represents very low interest rates, traders may purchase the USD (like the JPY) as a ‘flight to safety’ as (stock) market conditions worsen, as capital is taken away from higher yielding currencies, such as the AUD & NZD.
On the other hand, if we expect the 10-year bond (yield) to appreciate, the (3rd chart) shows how we may also expect a strengthening USD to accompany this bond (yield) rally. The (4th chart) currently shows a considerable spread between 10 & 30 year bond issues, which we normally would expect to occur. Major economic transitions can follow periods of time when these yields draw closer together, but current conditions do not tell us that. As the 30-year bond continues to pay a considerably higher yield than the 10-year, this tells us the bond market forecasts better economic conditions the further we look into the future.
Although major changes in our economies occur quite infrequently and may not apply to most traders, especially those with a short-term outlook, the more information we have at our disposal can ultimately help us to become better traders / investors. As the old adage goes…”The trend is your friend”, we can use this analysis to ensure that we find ourselves on the right side of the trade. Furthermore, long-term market analysis can help us identify possible changes in economic conditions, and help us prepare for the future which always offers us the unknown.
We wish you the best of luck in all your trading endeavors.
Information on these pages contains forward-looking statements that involve risks and uncertainties. Markets and instruments profiled on this page are for informational purposes only and should not in any way come across as a recommendation to buy or sell in these assets. You should do your own thorough research before making any investment decisions. FXStreet does not in any way guarantee that this information is free from mistakes, errors, or material misstatements. It also does not guarantee that this information is of a timely nature. Investing in Open Markets involves a great deal of risk, including the loss of all or a portion of your investment, as well as emotional distress. All risks, losses and costs associated with investing, including total loss of principal, are your responsibility. The views and opinions expressed in this article are those of the authors and do not necessarily reflect the official policy or position of FXStreet nor its advertisers. The author will not be held responsible for information that is found at the end of links posted on this page.
If not otherwise explicitly mentioned in the body of the article, at the time of writing, the author has no position in any stock mentioned in this article and no business relationship with any company mentioned. The author has not received compensation for writing this article, other than from FXStreet.
FXStreet and the author do not provide personalized recommendations. The author makes no representations as to the accuracy, completeness, or suitability of this information. FXStreet and the author will not be liable for any errors, omissions or any losses, injuries or damages arising from this information and its display or use. Errors and omissions excepted.
The author and FXStreet are not registered investment advisors and nothing in this article is intended to be investment advice.
Editors’ Picks

EUR/USD trims gains, back below 1.1800
EUR/USD now loses some upside momentum, returning to the area below the 1.1800 support as the Greenback manages to regain some composure following the SCOTUS-led pullback earlier in the session.

GBP/USD off highs, recedes to the sub-1.3500 area
Following earlier highs north of 1.3500 the figure, GBP/USD now faces some renewed downside pressure, revisiting the 1.3490 zone as the US Dollar manages to regain some upside impulse in the latter part of the NA session on Friday.

USD/JPY sticks to gains above 155.00, over one-week top ahead of US data
The USD/JPY pair gains positive traction for the third straight day and climbs to over a one-week top, around the 155.35-155.40 region. Data released early today showed that Japan’s key inflation gauge eased to the slowest pace in two years, tempering expectations for an immediate policy tightening by the Bank of Japan.
Editors’ Picks

EUR/USD: US Dollar comeback in the makes? Premium
The US Dollar (USD) stands victorious at the end of another week, with the EUR/USD pair trading near a four-week low of 1.1742, while the USD retains its strength despite some discouraging American data released at the end of the week.

Gold: Escalating geopolitical tensions help limit losses Premium
Gold (XAU/USD) struggled to make a decisive move in either direction this week as it quickly recovered above $5,000 after posting losses on Monday and Tuesday.

GBP/USD: Pound Sterling braces for more pain, as 200-day SMA tested Premium
The Pound Sterling (GBP) crashed to its lowest level in a month against the US Dollar (USD), as critical support levels were breached in a data-packed week.

Bitcoin: No recovery in sight
Bitcoin (BTC) price continues to trade within a range-bound zone, hovering around $67,000 at the time of writing on Friday, and falling slightly so far this week, with no signs of recovery.

US Dollar: Tariffed. Now What? Premium
The US Dollar (USD) reversed its previous week’s decline, managing to stage a meaningful rebound and retesting the area just above the 98.00 barrier when tracked by the US Dollar Index (DXY).
RECOMMENDED LESSONS
Making money in forex is easy if you know how the bankers trade!
I’m often mystified in my educational forex articles why so many traders struggle to make consistent money out of forex trading. The answer has more to do with what they don’t know than what they do know. After working in investment banks for 20 years many of which were as a Chief trader its second knowledge how to extract cash out of the market.
5 Forex News Events You Need To Know
In the fast moving world of currency markets where huge moves can seemingly come from nowhere, it is extremely important for new traders to learn about the various economic indicators and forex news events and releases that shape the markets. Indeed, quickly getting a handle on which data to look out for, what it means, and how to trade it can see new traders quickly become far more profitable and sets up the road to long term success.
Top 10 Chart Patterns Every Trader Should Know
Chart patterns are one of the most effective trading tools for a trader. They are pure price-action, and form on the basis of underlying buying and selling pressure. Chart patterns have a proven track-record, and traders use them to identify continuation or reversal signals, to open positions and identify price targets.
7 Ways to Avoid Forex Scams
The forex industry is recently seeing more and more scams. Here are 7 ways to avoid losing your money in such scams: Forex scams are becoming frequent. Michael Greenberg reports on luxurious expenses, including a submarine bought from the money taken from forex traders. Here’s another report of a forex fraud. So, how can we avoid falling in such forex scams?
What Are the 10 Fatal Mistakes Traders Make
Trading is exciting. Trading is hard. Trading is extremely hard. Some say that it takes more than 10,000 hours to master. Others believe that trading is the way to quick riches. They might be both wrong. What is important to know that no matter how experienced you are, mistakes will be part of the trading process.
The challenge: Timing the market and trader psychology
Successful trading often comes down to timing – entering and exiting trades at the right moments. Yet timing the market is notoriously difficult, largely because human psychology can derail even the best plans. Two powerful emotions in particular – fear and greed – tend to drive trading decisions off course.