EUR/USD Current price: 1.1322
View Live Chart for the EUR/USD

The American dollar ended the day with some tepid gains across the board, in a quiet Monday with low volumes being the theme of the day. Asian stocks closed in the red, as Chinese data, which resulted mixed, failed to spook the ghost of a steady economic slowdown. Read GDP in China grew 6.9% from a year earlier in Q3, whilst the industrial sector continued to weaken, as October Industrial Production came out at 5.7% yearly basis, below the 6.0% expected and the previous 6.1%. There were no fundamental releases in Europe, although ECB's Nowotny once again hit the wires, saying that the EU may need to become more expansive, to secure economic growth.
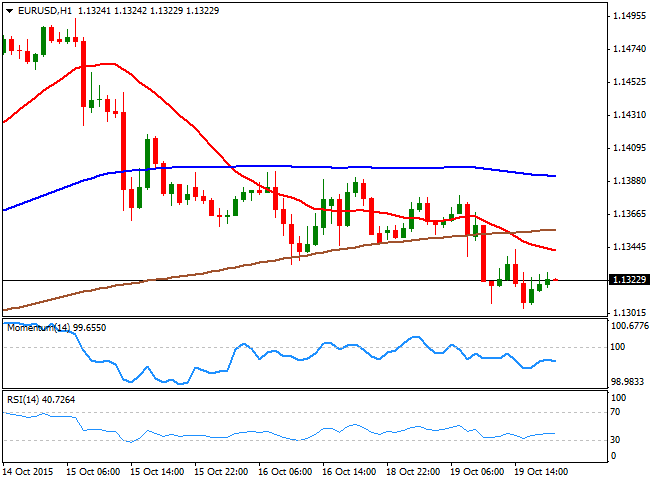
The EUR/USD pair fell as low as 1.1305, a level not seen since October 9th. Having bounce in early New York trading, the pair met selling interest around 1.1345, now the immediate resistance. Technically, the pair presents a bearish tone in the short term, as the 1 hour chart shows that the price has fallen below its moving averages, with the shortest presenting a strong bearish slope around the mentioned 1.1345 level. In the same chart, the technical indicators present a mid negative tone below their mid-lines, supporting additional declines on a break below 1.1280, a major static support. In the 4 hours chart, the 20 SMA continues heading south around the current price, now around 1.1385, whilst the technical indicators have bounced partially from near oversold readings, but remain well below their mid-lines.
Support levels: 1.1280 1.1240 1.1200
Resistance levels: 1.1345 1.1385 1.1420
EUR/JPY Current price: 135.23
View Live Chart for the EUR/JPY
The EUR/JPY pair edged slightly lower, but held above the 135.00 in extremely thin trading. The decline can be attributed to EUR weakness, as the Japanese yen closed lower against most of its other rivals. An early advance found sellers around the 100 DMA, at 135.90, still the major resistance level to break to see the pair advancing. Short term, the 1 hour chart presents a bearish bias, with the 100 SMA crossing below the 200 DMA above the current level, and the technical indicators lacking directional strength, but well below their mid-lines. In the 4 hours chart, the price hovers around its 100 and 200 SMAs, both horizontal in a tight 20 pips range and reflecting the lack of a directional trend, whilst the Momentum indicator aims higher around 100 and the RSI indicator also heads north, but at 43, all of which limits chances of a stronger advance as long as the mentioned resistance continues to cap the upside.
Support levels: 134.70 134.10 133.60
Resistance levels: 135.45 135.90 136.40
GBP/USD Current price: 1.5466
View Live Chart for the GPB/USD
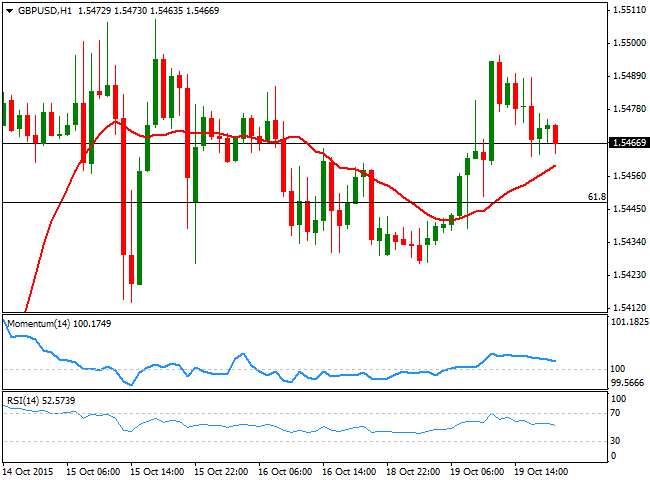
The British Pound flirted once again with the 1.5500 level against the greenback, helped by a bout of EUR selling which sent the EUR/GBP sharply lower. The UK macroeconomic calendar has been empty and will remain so for the upcoming days, which means that the pair will likely maintain its bullish tone, as the greenback has little chances of advancing steadily in the light of the latest weak data which continues to signal a delay in the US rate hike. The 1 hour chart shows that the pair has held for most of the day above the 61.8% retracement of its latest decline, at 1.5445 with intraday deeps below it quickly meeting buying interest. Technically, the 1 hour chart shows that the price is a few pips above its 20 SMA, but that the technical indicators head nowhere, right above their mid-lines, rather reflecting the absence of volume than a probable decline. In the 4 hours chart, the price is hovering around a strongly bullish 20 SMA, whilst the Momentum indicator is flat around its 100 level and the RSI indicator heads slightly lower around 57, also giving no clear clues on what's next for the pair.
Support levels: 1.5445 1.5415 1.5380
Resistance levels: 1.5495 1.5530 1.5565
USD/JPY Current price: 119.39
View Live Chart for the USD/JPY
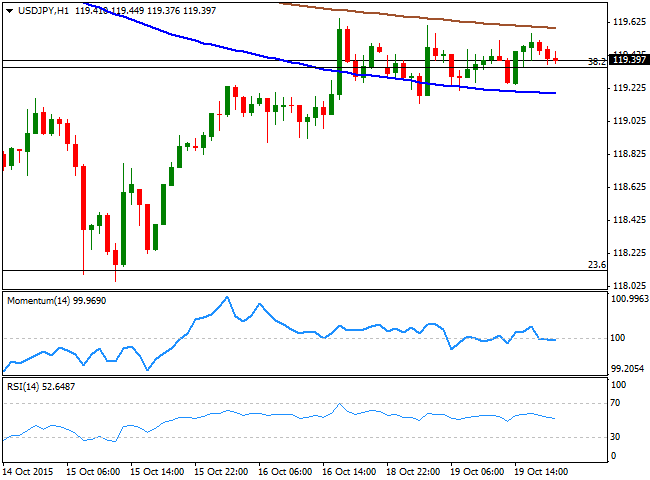
The USD/JPY pair traded within a 50 pips range around the 119.35 level, the 38.2% retracement of its latest weekly decline, having been unable to advance steadily on spikes above the level. Following last week's decline down to 118.05 the pair has reentered the range that contained the price since late August, although it continues holding near the base of it, risking another break lower in the upcoming days. Technically, the 1 hour chart shows that the price is between its 100 and 200 SMAs, with the largest acting as an immediate intraday resistance around 119.65, and both presenting bearish slopes. In the same chart, the technical indicators have eased from their early momentum and stand now flat around their mid-lines. In the 4 hours chart, the recovery stalled well below the 100 and 200 SMAs, whilst the Momentum indicator turned sharply lower, but still holds above its 100 level, whilst the RSI indicator is turning south around 52. At this point, the pair needs to break below 118.90 to confirm a bearish continuation, with some steady gains above the mentioned 119.65 level favoring a test of the 120.00 region.
Support levels: 118.90 118.55 118.05
Resistance levels: 119.65 120.00 120.35
AUD/USD Current price: 0.7252
View Live Chart for the AUD/USD
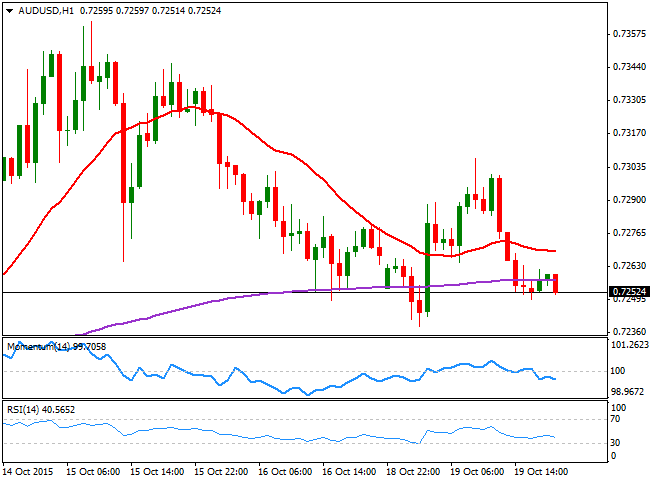
The AUD/USD pair erased all of its early gains and closed the red with limited losses in the 0.7250 price zone, with the Aussie weighed by the poor performance of commodities and the negative tone in stocks across all of the major markets. During the upcoming Asian session, the RBA will release the Minutes of its latest economic policy meeting, and investors will be looking for clues on a possible upcoming rate cut in Australia, something quite unlikely, at least for this 2015. A more hawkish than-expected wording may see the AUD recover the ground lost, although selling interest is now waiting around the 0.7300 figure. Technically, the 1 hour chart shows that the price remains below its 20 SMA, whilst the technical indicators head south below their mid-lines, in line with additional declines. In the 4 hours chart, the price has retreated from a horizontal 20 SMA whilst the technical indicators lack directional strength below their mid-lines.
Support levels: 0.7240 0.7210 0.7170
Resistance levels: 0.7290 0.7335 0.7380
Information on these pages contains forward-looking statements that involve risks and uncertainties. Markets and instruments profiled on this page are for informational purposes only and should not in any way come across as a recommendation to buy or sell in these assets. You should do your own thorough research before making any investment decisions. FXStreet does not in any way guarantee that this information is free from mistakes, errors, or material misstatements. It also does not guarantee that this information is of a timely nature. Investing in Open Markets involves a great deal of risk, including the loss of all or a portion of your investment, as well as emotional distress. All risks, losses and costs associated with investing, including total loss of principal, are your responsibility. The views and opinions expressed in this article are those of the authors and do not necessarily reflect the official policy or position of FXStreet nor its advertisers. The author will not be held responsible for information that is found at the end of links posted on this page.
If not otherwise explicitly mentioned in the body of the article, at the time of writing, the author has no position in any stock mentioned in this article and no business relationship with any company mentioned. The author has not received compensation for writing this article, other than from FXStreet.
FXStreet and the author do not provide personalized recommendations. The author makes no representations as to the accuracy, completeness, or suitability of this information. FXStreet and the author will not be liable for any errors, omissions or any losses, injuries or damages arising from this information and its display or use. Errors and omissions excepted.
The author and FXStreet are not registered investment advisors and nothing in this article is intended to be investment advice.
Recommended Content
Editors’ Picks

USD/JPY pops and drops on BoJ's expected hold
USD/JPY reverses a knee-jerk spike to 142.80 and returns to the red below 142.50 after the Bank of Japan announced on Friday that it maintained the short-term rate target in the range of 0.15%-0.25%, as widely expected. Governor Ueda's press conference is next in focus.

AUD/USD bears attack 0.6800 amid PBOC's status-quo, cautious mood
AUD/USD attacks 0.6800 in Friday's Asian trading, extending its gradual retreat after the PBOC unexpectedly left mortgage lending rates unchanged in September. A cautious market mood also adds to the weight on the Aussie. Fedspeak eyed.

Gold consolidates near record high, bullish potential seems intact
Gold price regained positive traction on Thursday and rallied back closer to the all-time peak touched the previous day in reaction to the Federal Reserve's decision to start the policy easing cycle with an oversized rate cut.

Ethereum rallies over 6% following decision to split Pectra upgrade into two phases
In its Consensus Layer Call on Thursday, Ethereum developers decided to split the upcoming Pectra upgrade into two batches. The decision follows concerns about potential risks in shipping the previously approved series of Ethereum improvement proposals.

Bank of Japan set to keep rates on hold after July’s hike shocked markets
The Bank of Japan is expected to keep its short-term interest rate target between 0.15% and 0.25% on Friday, following the conclusion of its two-day monetary policy review. The decision is set to be announced during the early Asian session.

Moneta Markets review 2024: All you need to know
VERIFIED In this review, the FXStreet team provides an independent and thorough analysis based on direct testing and real experiences with Moneta Markets – an excellent broker for novice to intermediate forex traders who want to broaden their knowledge base.