EUR/USD Current price: 1.0916
View Live Chart for the EUR/USD
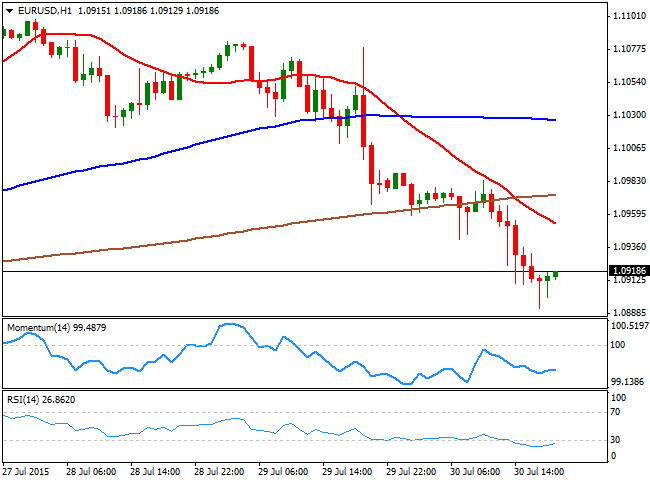
The American dollar remained buoyed all through this Thursday, as macroeconomic events continued supporting the US is in its way to raise rates. During the European session, German unemployment unexpectedly rose in July by 9,000 against expectations of a 5K decline, whilst inflation in the country in July resulted at 0.2% both monthly and yearly basis, missing expectations. Also released in the morning, the EU economic sentiment indicator climbed to 104.0 from previous 103.5, on diminishing risk coming from Greece. The US GDP for the Q2 however, was what defined the day, printing in its advanced reading 2.3%. The number was a bit below expected, but far better than the Q1, revised up to 0.6% from previous -0.2%. Alongside with the GDP figure, unemployment claims in the US resulted better than expected, printing 267K for the week ending July 24.
The EUR/USD came under selling pressure with the news, falling down to 1.0892 in the American afternoon, before regaining the 1.0900 level, but maintaining the overall negative tone. The short term technical picture suggest some downward exhaustion, as the technical indicators are losing their downward strength in oversold levels, although the price remains well below a bearish 20 SMA, currently around 1.0950. In the 4 hours chart, the RSI indicator continues to head south near 30, whilst the Momentum indicator stands flat well into negative territory, all of which suggest a limited upward corrective movement before a new leg south.
Support levels: 1.0880 1.0850 1.0810
Resistance levels: 1.0950 1.1000 1.1045
EUR/JPY Current Price: 135.64
View Live Chart for the EUR/JPY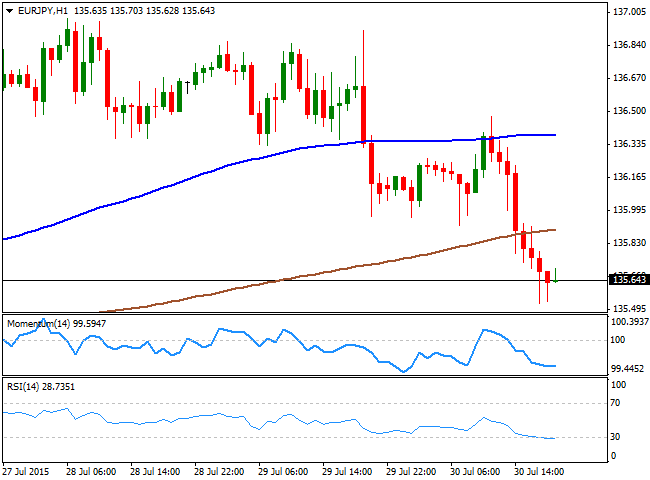
Euro negative tone has sent the EUR/JPY down to a fresh weekly low of 135.52, with the JPY posting a moderate decline against the greenback, amid falling stocks. The EUR/JPY trades near the low by the end of the end, and the 1 hour chart shows that the price was unable to extend beyond the 100 SMA, and finally capitulated, breaking below the 200 SMA now around 135.90 acting as an immediate intraday resistance. In the same chart, the technical indicators have lost their bearish strength, but remain near oversold levels, limiting the possibility of a stronger advance. In the 4 hours chart, the technical indicators head lower below their mid-lines, whilst the price pressures a horizontal 20 SMA, supporting a continued decline on a break through 135.40, the immediate support.
Support levels: 135.40 134.90 134.50
Resistance levels: 135.90 136.60 137.10
GBP/USD Current price: 1.5592
View Live Chart for the GPB/USD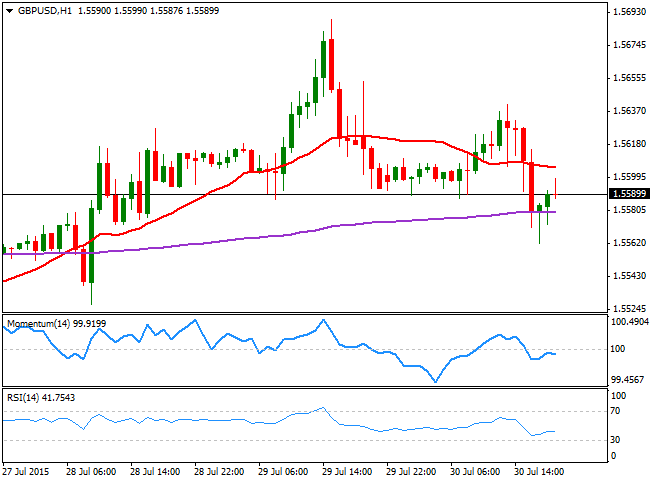
The GBP/USD pair has shown little progress daily basis, for the most hovering around the 1.5600 level. There was no fundamental data released in the UK, but the Pound refused to give up to dollar's strength. Technically however, the pair continued retreating from the high established earlier this week at 1.5689, posting a lower low and a lower high daily basis, which increases the risk of a continued decline. Short term, the 1 hour chart shows that the price is now developing below a horizontal 20 SMA, whilst the technical indicators lack directional strength in neutral territory. In the 4 hours chart, the price is now a handful of pips below its 20 SMA that maintains a bullish slope, whilst the technical indicators present strong bearish slopes and are about to cross their mid-lies towards the downside. The daily low of 1.5561 converges with the 200 EMA in this last time frame, suggesting a break below it is required to confirm a new leg south.
Support levels: 1.5560 1.5520 1.5485
Resistance levels: 1.5635 1.5670 1.5730
USD/JPY Current price: 124.29
View Live Chart for the USD/JPY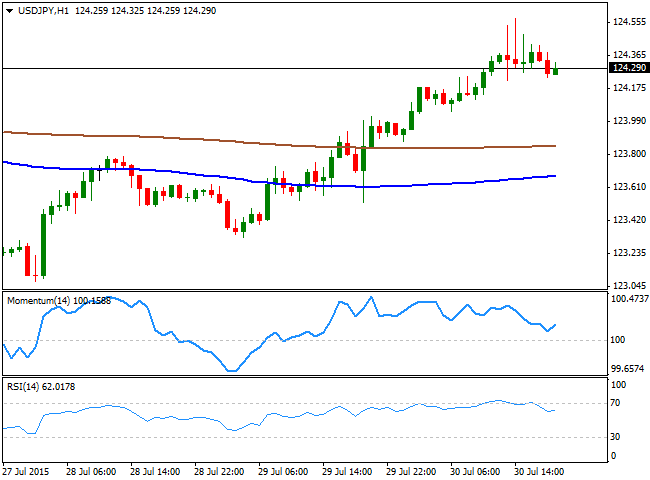
The USD/JPY reached a fresh monthly high of 124.57 on the back of dollar's strong GDP readings, but was unable to run higher and pulled back in the American afternoon, holding, however, above the 124.00 level. During the upcoming session, Japan will release its National and Tokyo inflation figures, but the readings usually have a limited effect in the currency. In the meantime, the short term picture is still bullish, as in the 1 hour chart, the price has advanced far above its 100 and 200 SMAs, whilst the technical indicators are turning north in positive territory, after correcting extreme overbought readings. In the 4 hours chart, the price has extended further above its 100 and 200 SMAs, but the technical indicators are turning south in positive territory, suggesting the pair may extend its retracement over the upcoming hours, back towards the 123.30/70 price zone.
Support levels: 124.10 123.70 123.30
Resistance levels: 124.60 125.00 125.30
AUD/USD Current price: 0.7285
View Live Chart for the AUD/USD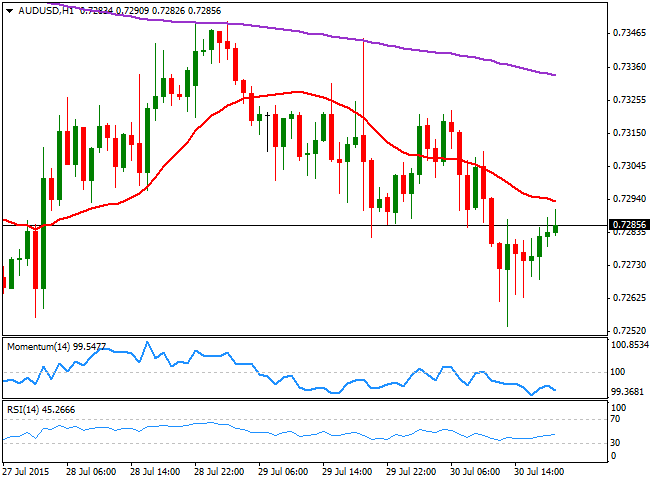
The AUD/USD pair has posted a fresh multi-year low, a few pips below the previous one at 0.7253, from where it bounced back to the 0.7290, maintaining anyway its dominant bearish trend. Earlier in the day, the commodity currency fell on the back of poor Australian data, as the trend estimate for total dwellings approved fell 1.2% in June, falling for the fourth month in a row. The seasonally adjusted estimate for total dwellings approved fell 8.2% in June following a rise of 2.3% in the previous month, according to the official release. Short term, the 1 hour chart shows that the price continues developing below a bearish 20 SMA whilst the technical indicators resumed their declines below their mid-lines, keeping the risk towards the downside. In the 4 hours chart, the 20 SMA stands flat above the current price, whilst the technical indicators are aiming to recover, but well below their mid-lines, anticipating some range trading before a new directional move.
Support levels: 0.7250 0.7220 0.7185
Resistance levels: 0.7320 0.7350 0.7390
Recommended Content
Editors’ Picks

USD/JPY pops and drops on BoJ's expected hold
USD/JPY reverses a knee-jerk spike to 142.80 and returns to the red below 142.50 after the Bank of Japan announced on Friday that it maintained the short-term rate target in the range of 0.15%-0.25%, as widely expected. Governor Ueda's press conference is next in focus.

AUD/USD bears attack 0.6800 amid PBOC's status-quo, cautious mood
AUD/USD attacks 0.6800 in Friday's Asian trading, extending its gradual retreat after the PBOC unexpectedly left mortgage lending rates unchanged in September. A cautious market mood also adds to the weight on the Aussie. Fedspeak eyed.

Gold consolidates near record high, bullish potential seems intact
Gold price regained positive traction on Thursday and rallied back closer to the all-time peak touched the previous day in reaction to the Federal Reserve's decision to start the policy easing cycle with an oversized rate cut.

Ethereum rallies over 6% following decision to split Pectra upgrade into two phases
In its Consensus Layer Call on Thursday, Ethereum developers decided to split the upcoming Pectra upgrade into two batches. The decision follows concerns about potential risks in shipping the previously approved series of Ethereum improvement proposals.

Bank of Japan set to keep rates on hold after July’s hike shocked markets
The Bank of Japan is expected to keep its short-term interest rate target between 0.15% and 0.25% on Friday, following the conclusion of its two-day monetary policy review. The decision is set to be announced during the early Asian session.

Moneta Markets review 2024: All you need to know
VERIFIED In this review, the FXStreet team provides an independent and thorough analysis based on direct testing and real experiences with Moneta Markets – an excellent broker for novice to intermediate forex traders who want to broaden their knowledge base.