EUR/USD Current Price: 1.0918
View Live Chart for the EUR/USD
The common currency refused to give up against the greenback on Friday, despite December's US Nonfarm payrolls report beat expectations by announcing the creation of 292K new jobs against expectations of 200K. Additionally, the headline reading for November was revised upward by 41K, while the unemployment rate remained steady at 5%. Wages were the big miss, as average hourly earnings fell 0.04%, far from market's expectations of a 0.2% growth. The dollar spiked after the release, ending the day with gains against most of its major rivals, exception made by the EUR and the JPY, both favored during the first week of the month, by risk sentiment triggered by China. Chinese stocks plummeting and authorities halting trading twice during this past week, have spurred risk aversion, leading to a strong demand of safe havens and funding currencies.
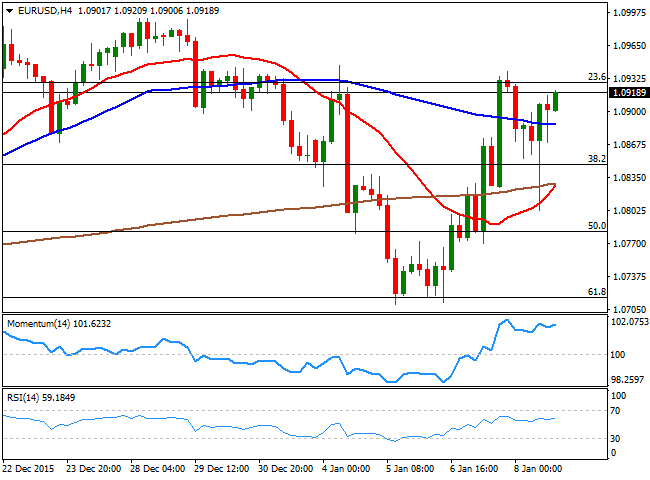
Anyway, the EUR/USD pair recovered from a daily low set at 1.0802 following the announcement, and closed the week a handful of pips below the high set at 1.0939, trapped between Fibonacci levels. Technically the daily chart shows that the price has fallen down to the 61.8% retracement of the December rally, where strong buying interest pushed it back higher, although sellers keep surging around the 23.6% of the same rally around 1.0925, the immediate resistance. In the same chart, the technical readings present quite a neutral stance as the technical indicators remain stuck around their mid-lines. Shorter term, and according to the 4 hours chart, bulls retain control, as the technical indicators are grinding higher above their mid-lines, whist the price has recovered above a now bullish 20 SMA. The immediate support for this Monday comes at 1.0845, the 38.2% retracement of the same rally.
Support levels: 1.0845 1.0800 1.0750
Resistance levels: 1.0925 1.0960 1.1000
EUR/JPY Current price: 128.29
View Live Chart for the EUR/JPY
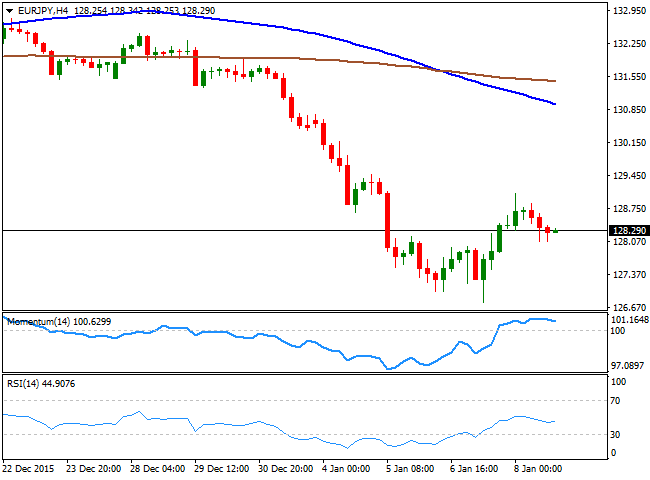
The EUR/JPY pair ended the week with strong losses, despite having recovered from a fresh 9-month low set on Thursday at 126.77, on the back of risk aversion. The Japanese yen advanced on Friday, following the sharp decline in worldwide stocks, and the EUR/JPY retreated from a high set at 129.07 maintaining the dominant bearish tone seen on previous updates. The daily chart shows that the late week recovery was barely enough for the technical indicators to correct extreme oversold readings, but are currently turning back south, suggesting the decline may continue this week. In the same chart, the 100 DMA has extended its decline further, well above the current level, in line with the ongoing bearish potential. In the 4 hours chart, the technical indicators are horizontal, with the Momentum above its 100 level and the RSI around 44, while the price is well below its 100 and 200 SMAs, all of which maintains the risk towards the downside, despite the absence of a clear directional strength.
Support levels: 128.00 127.50 127.15
Resistance levels: 128.65 129.10 129.60
GBP/USD Current price: 1.4525
View Live Chart for the GBP/USD
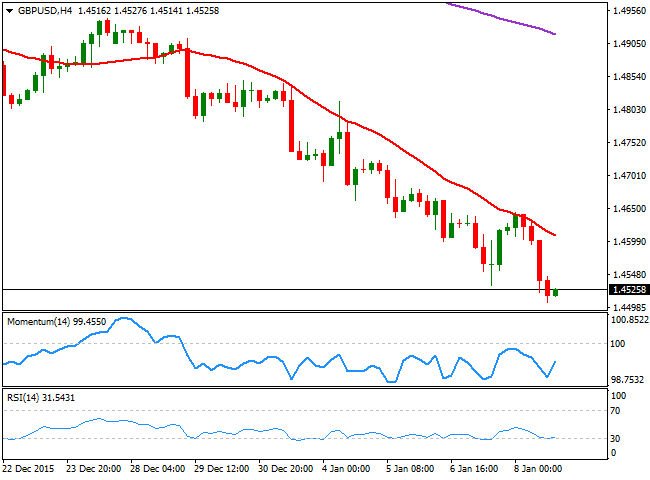
The British Pound continued trading heavily against all of its major rivals, falling down to 1.4504 against the greenback, its lowest since June 2010. The GBP/USD pair has been on a freefall ever since the week started, with the technical bearish momentum prevailing ahead of a new weekly opening, regardless the extreme oversold reading appreciated in the daily chart. In this chart, the price has accelerated strongly below a bearish 20 SMA, whilst the Momentum indicator has turned sharply lower well below the 100 level, and the RSI indicator heads south around 21. The pair has closed in the red for eight days in-a-row, which means an upward corrective movement cannot be disregarded, although selling at higher levels is still seen as a viable option. Shorter term, the 4 hours chart continues heading lower above the current level and capping the upside around 1.4610, while the technical indicators are posting tepid bounces from near oversold levels, rather reflecting the latest consolidation than supporting an upward move.
Support levels: 1.4500 1.4470 1.4435
Resistance levels: 1.4550 1.4590 1.4625
USD/JPY Current price: 117.49
View Live Chart for the USD/JPY
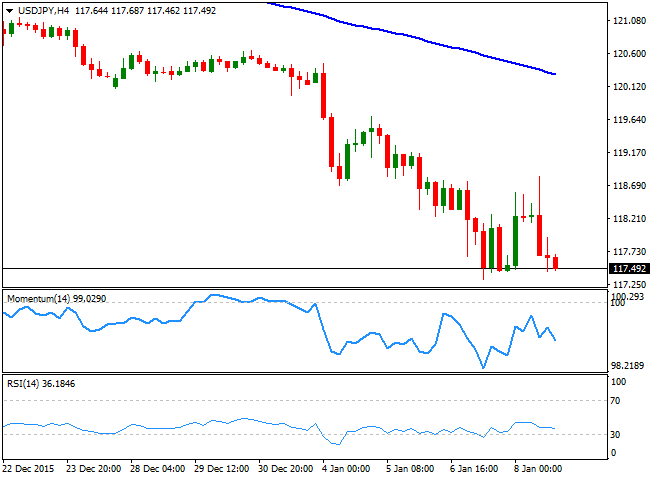
The USD/JPY pair closed the week at 117.49, its lowest in five months, with Japanese yen's momentum being driven by plummeting stocks amid risk sentiment. Despite the US monthly employment report resulted generally better-than-expected, demand for the safe haven currency prevailed, and after an initial spike up to 118.81, the pair turned south to close the day flat. The daily chart shows a long upper shadow, reflecting that strong selling interest still dominates the pair, whilst the technical indicators maintain heir bearish tone within oversold territory and the price remains far below its 100 and 200 DMAs, in line with another leg south towards 116.16, the low set in August. In the 4 hours chart, the bearish tone is also present, with the technical indicators resuming their declines below their mid-lines and the price developing well below its moving averages. The weekly low was set at 117.32, and a downward acceleration below the level should open doors for the bearish continuation expected towards the mentioned 116.16 low.
Support levels: 117.25 116.80 116.40
Resistance levels: 117.90 118.40 118.80
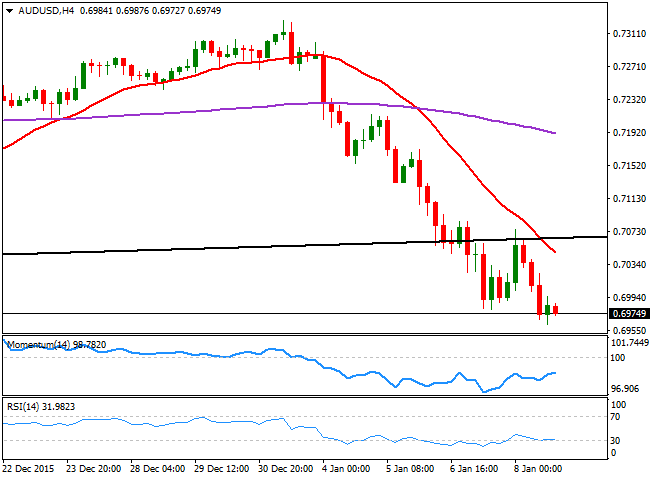
AUD/USD Current price: 0.6974
View Live Chart for the AUD/USD
The Australian dollar had a miserable week amid Chinese woes, and the AUD/USD closed below the 0.7000 level for the first time since early September, when it set a multi-year low at 0.6906. In fact, the pair broke below a daily ascendant trend line coming from the mentioned low, and even completed a pullback to it before resuming its decline and reaching fresh lows, all of which suggest the pair will extend its decline during the upcoming days. In the daily chart, the technical indicators maintain their sharp bearish slopes well into negative territory, while the 20 SMA has turned lower, but far above the current level. Also, the pair accumulates a continued five-day decline, which means an upward corrective movement is possible before a new leg south. Shorter term, the 4 hours chart shows that the 20 SMA has accelerated its decline, and maintains a strong bearish slope, while the technical indicators are consolidating near oversold readings, lacking clear directional strength at the time being.
Support levels: 0.6955 0.6905 0.6860
Resistance levels: 0.7000 0.7040 0.7075
Information on these pages contains forward-looking statements that involve risks and uncertainties. Markets and instruments profiled on this page are for informational purposes only and should not in any way come across as a recommendation to buy or sell in these assets. You should do your own thorough research before making any investment decisions. FXStreet does not in any way guarantee that this information is free from mistakes, errors, or material misstatements. It also does not guarantee that this information is of a timely nature. Investing in Open Markets involves a great deal of risk, including the loss of all or a portion of your investment, as well as emotional distress. All risks, losses and costs associated with investing, including total loss of principal, are your responsibility. The views and opinions expressed in this article are those of the authors and do not necessarily reflect the official policy or position of FXStreet nor its advertisers. The author will not be held responsible for information that is found at the end of links posted on this page.
If not otherwise explicitly mentioned in the body of the article, at the time of writing, the author has no position in any stock mentioned in this article and no business relationship with any company mentioned. The author has not received compensation for writing this article, other than from FXStreet.
FXStreet and the author do not provide personalized recommendations. The author makes no representations as to the accuracy, completeness, or suitability of this information. FXStreet and the author will not be liable for any errors, omissions or any losses, injuries or damages arising from this information and its display or use. Errors and omissions excepted.
The author and FXStreet are not registered investment advisors and nothing in this article is intended to be investment advice.
Recommended Content
Editors’ Picks
USD/JPY holds near 155.50 after Tokyo CPI inflation eases more than expected

USD/JPY is trading tightly just below the 156.00 handle, hugging multi-year highs as the Yen continues to deflate. The pair is trading into 30-plus year highs, and bullish momentum is targeting all-time record bids beyond 160.00, a price level the pair hasn’t reached since 1990.
AUD/USD stands firm above 0.6500 with markets bracing for Aussie PPI, US inflation

The Aussie Dollar begins Friday’s Asian session on the right foot against the Greenback after posting gains of 0.33% on Thursday. The AUD/USD advance was sponsored by a United States report showing the economy is growing below estimates while inflation picked up.
Gold soars as US economic woes and inflation fears grip investors

Gold prices advanced modestly during Thursday’s North American session, gaining more than 0.5% following the release of crucial economic data from the United States. GDP figures for the first quarter of 2024 missed estimates, increasing speculation that the US Fed could lower borrowing costs.
Ethereum could remain inside key range as Consensys sues SEC over ETH security status

Ethereum appears to have returned to its consolidating move on Thursday, canceling rally expectations. This comes after Consensys filed a lawsuit against the US SEC and insider sources informing Reuters of the unlikelihood of a spot ETH ETF approval in May.
Bank of Japan expected to keep interest rates on hold after landmark hike

The Bank of Japan is set to leave its short-term rate target unchanged in the range between 0% and 0.1% on Friday, following the conclusion of its two-day monetary policy review meeting for April. The BoJ will announce its decision on Friday at around 3:00 GMT.
