EUR/USD Current price: 1.1243
View Live Chart for the EUR/USD

Two Central Banks have passed offering nothing really ground breaking, but helping the American dollar in recovering some ground after falling down to fresh weekly lows against the EUR and the GBP. In Europe, stocks opened with a soft tone, and remain quiet around their opening, waiting for the US Central Bank's minutes, to be released later in the American afternoon. Macroeconomic data coming from Germany disappointed once again, with the trade balance surplus well below previous month one at €19.6B in August, whilst export and imports posted a sharp decline.
The ECB released the Accounts of its latest meeting, with the Central Bank expressing its concern over the slowdown in emerging markets weighing in global growth, whilst the local recovery has been weaker than previously expected. The ECB also said that it has been front buying ever since September, and will continue to do so until November.
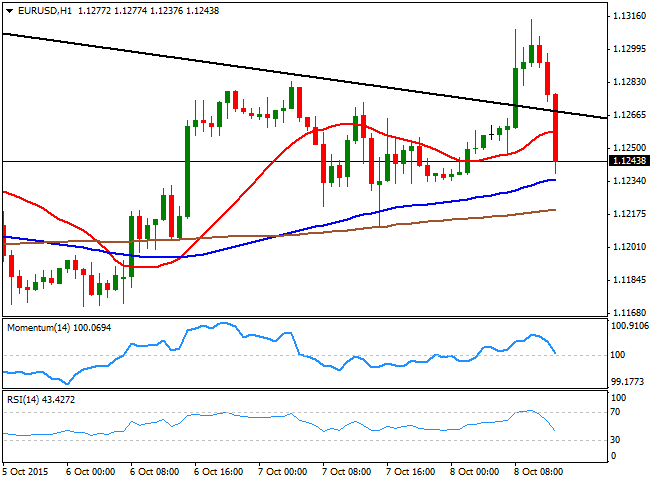
The EUR/USD pair pulled down from a daily high of 1.1314 and accelerated its decline after losing again the 1.1280, and falling as low as 1.1239. In the US, the weekly unemployment claims came out better-than-expected, down to 263K in the week ending October 2. The 1 hour chart shows that the price temporary broke above the daily descendant trend line coming form 1.1713, but is now below it, with the technical indicators heading sharply lower and the price below the 20 SMA, supporting a downward continuation short term. In the 4 hours chart, the price is now struggling around its 20 SMA, whilst the technical indicators also turned sharply lower, but hold above their mid-lines.
Support levels: 1.1200 1.1160 1.1120
Resistance levels: 1.1285 1.1335 1.1370
GBP/USD Current price: 1.5270
View Live Chart for the GPB/USD
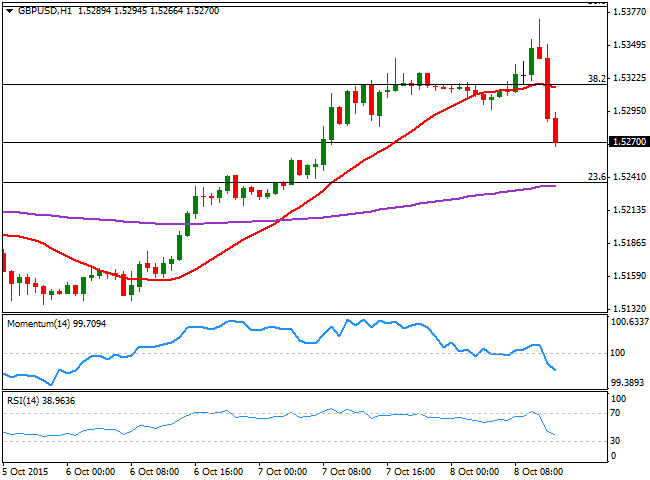
The Bank of England left its economic policy unchanged, largely in line with market's expectations, with 1 out of 9 MPC members voting for a rate hike. The tone was mild dovish, as the BOE expressed its concern over the currency strength while downgrading its inflation expectations, now seen below 1% until 2016 spring. The GBP/USD pair retreated from a fresh weekly high of 1.5371, accelerating its decline below the 1.5300 level on the back of EUR decline, accelerating lower on the back of US employment data. The 1 hour chart shows that the indicators head sharply lower near oversold territory, whilst the 20 SMA is now turning south around 1.5315, the 38.2% retracement of the latest daily decline. In the 4 hours chart, the technical indicators retreat from overbought levels, but the price is well above its 20 SMA that now converges with the 23.6% retracement of the same rally around 1.5240.
Support levels: 1.5240 1.5210 1.5170
Resistance levels: 1.5315 1.5340 1.5390
USD/JPY Current price: 119.92
View Live Chart for the USD/JPY
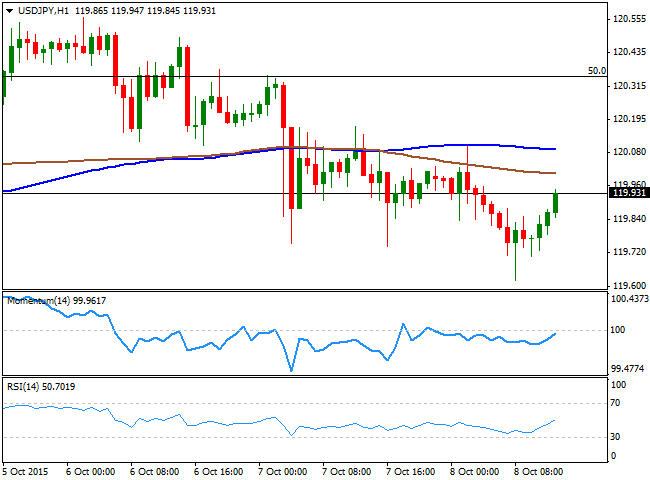
Increasing bearish potential. The USD/JPY pair remains flat, but daily basis, it has posted a lower low at 116.62m whilst the upside remains capped by selling interest around the 120.00 figure. With the pair still within its recent range, the daily chart shows that the bearish potential increases as the price moves further below the 200 DMA, whilst the 100 DMA gains bearish strength above the other. Shorter term, the 1 hour chat shows that the price holds below its 100 and 200 SMAs, whilst the technical indicators have bounced and are about to cross their mid-lines towards the upside, on the recent dollar's momentum. In the 4 hours chart, the technical indicators also turned north, but remain below their mid-lines, whilst the price remains below its moving averages. The pair needs to break above 120.35, a Fibonacci resistance, to confirm additional intraday gains that anyway will hardly extend beyond 121.00
Support levels: 119.60 119.35 118.90
Resistance levels: 120.35 120.70 121.00
AUD/USD Current price: 0.7170
View Live Chart for the AUD/USD
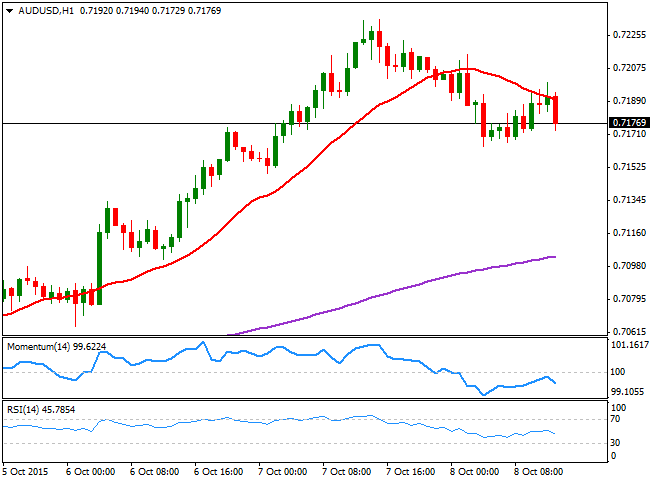
The AUD/USD pair is easing from its Wednesday high, as dollar advances ahead of the American opening, weighed by a sudden decline in gold prices amid dollar's demand. The 1 hour chart shows that the price is being capped by a bearish 20 SMA, whilst the technical indicators turned south below their mid-lines. In the 4 hours chart, the technical indicators are pointing for a downward correction, heading south from extreme overbought levels, whilst the 20 SMA aims higher around 0.7145, providing an immediate support in the case of further declines.
Support levels: 0.7145 0.7110 0.7080
Resistance levels: 0.7200 0.7235 0.7280
Information on these pages contains forward-looking statements that involve risks and uncertainties. Markets and instruments profiled on this page are for informational purposes only and should not in any way come across as a recommendation to buy or sell in these assets. You should do your own thorough research before making any investment decisions. FXStreet does not in any way guarantee that this information is free from mistakes, errors, or material misstatements. It also does not guarantee that this information is of a timely nature. Investing in Open Markets involves a great deal of risk, including the loss of all or a portion of your investment, as well as emotional distress. All risks, losses and costs associated with investing, including total loss of principal, are your responsibility. The views and opinions expressed in this article are those of the authors and do not necessarily reflect the official policy or position of FXStreet nor its advertisers. The author will not be held responsible for information that is found at the end of links posted on this page.
If not otherwise explicitly mentioned in the body of the article, at the time of writing, the author has no position in any stock mentioned in this article and no business relationship with any company mentioned. The author has not received compensation for writing this article, other than from FXStreet.
FXStreet and the author do not provide personalized recommendations. The author makes no representations as to the accuracy, completeness, or suitability of this information. FXStreet and the author will not be liable for any errors, omissions or any losses, injuries or damages arising from this information and its display or use. Errors and omissions excepted.
The author and FXStreet are not registered investment advisors and nothing in this article is intended to be investment advice.
Recommended Content
Editors’ Picks
USD/JPY holds near 155.50 after Tokyo CPI inflation eases more than expected

USD/JPY is trading tightly just below the 156.00 handle, hugging multi-year highs as the Yen continues to deflate. The pair is trading into 30-plus year highs, and bullish momentum is targeting all-time record bids beyond 160.00, a price level the pair hasn’t reached since 1990.
AUD/USD stands firm above 0.6500 with markets bracing for Aussie PPI, US inflation

The Aussie Dollar begins Friday’s Asian session on the right foot against the Greenback after posting gains of 0.33% on Thursday. The AUD/USD advance was sponsored by a United States report showing the economy is growing below estimates while inflation picked up.
Gold soars as US economic woes and inflation fears grip investors

Gold prices advanced modestly during Thursday’s North American session, gaining more than 0.5% following the release of crucial economic data from the United States. GDP figures for the first quarter of 2024 missed estimates, increasing speculation that the US Fed could lower borrowing costs.
FBI cautions against non-KYC Bitcoin and crypto money transmitting services as SEC goes after MetaMask

US FBI has issued a caution to Bitcoiners and cryptocurrency market enthusiasts, coming on the same day as when the US Securities and Exchange Commission is on the receiving end of a lawsuit, with a new player adding to the list of parties calling for the regulator to restrain its hand.
Bank of Japan expected to keep interest rates on hold after landmark hike

The Bank of Japan is set to leave its short-term rate target unchanged in the range between 0% and 0.1% on Friday, following the conclusion of its two-day monetary policy review meeting for April. The BoJ will announce its decision on Friday at around 3:00 GMT.