EUR/USD Current price: 1.0923
View Live Chart for the EUR/USD
The financial world is all about risk aversion this Tuesday, and not only because of a more than likely Grexit, but also due to the chaos going on in Chinese equity markets. The Shanghai Composite has been experiencing wild, extreme, intraday moves, having shed 27% in the last 3 weeks, despite the governments intervention to halt the extreme volatility. Commodities plunged alongside with stocks, boosting ever further dollar's demand. As for Europe, EU ministers and authorities are getting exhausted, to say it politely, of Greek demands, and seems that they are closer to let Athens go on its own than to offer another chance.
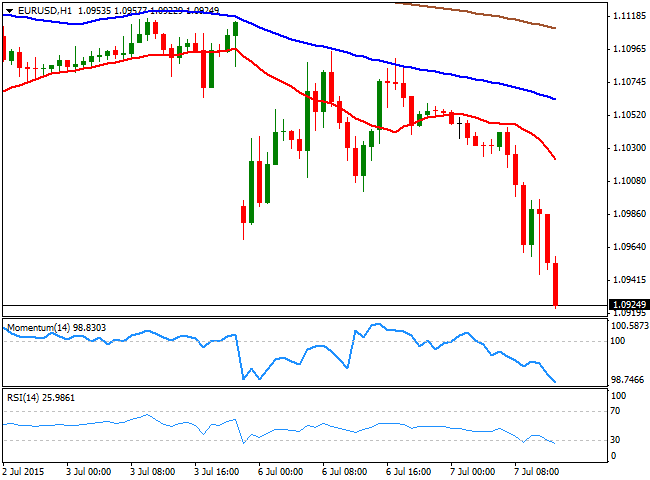
The EUR/USD pair trades at its lowest level in 5 weeks, around 1.0920, with a strong downward potential in the short term, despite having already fell around 130 pips ever since the day started. In the 1 hour chart, the price has accelerated below its 20 SMA, whilst the technical indicators maintain their strong bearish slopes, despite being in oversold territory. In the 4 hours chart, the technical picture also favors the downside, particularly on a break below 1.0920, the immediate support.
Support levels: 1.0920 1.0880 1.0840
Resistance levels: 1.0955 1.1000 1.1050
GBP/USD Current price: 1.5422
View Live Chart for the GBP/USD
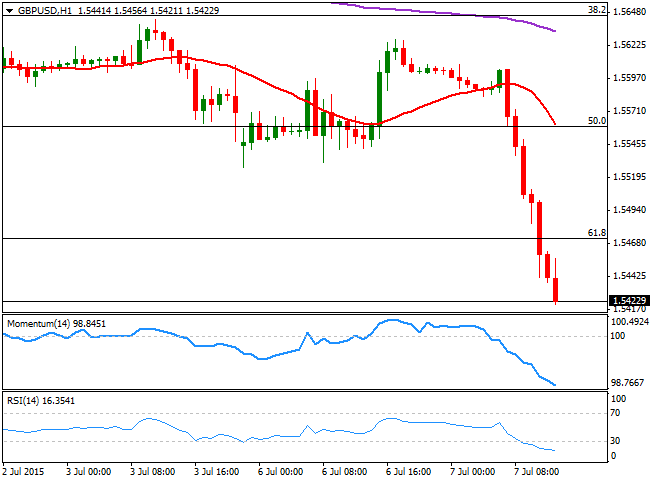
The British Pound has fell sharply against the greenback, with the pair approaching the 1.5400 figure ahead of the US opening. Tepid UK manufacturing figures due to a stronger Pound in May, alongside with dollar's demand, have dragged the pair lower, and additionally, the pair has triggered stops below critical Fibonacci support levels, which accelerated the decline. The pair has broke below the 61.8% retracement of its latest bullish run around 1.5475, the main resistance now in the case of a sudden reversal. Short term, the 1 hour chart shows that the technical indicators maintain strong bearish slope despite in extreme oversold territory, whilst in the 4 hours chart the pair has also a strong downward potential, and the price has scope to extend down to 1.5360 on a break below the 1.5400 figure.
Support levels: 1.5400 1.5360 1.5325
Resistance levels: 1.5475 1.5520 1.5560
USD/JPY Current price: 122.47
View Live Chart for the USD/JPY
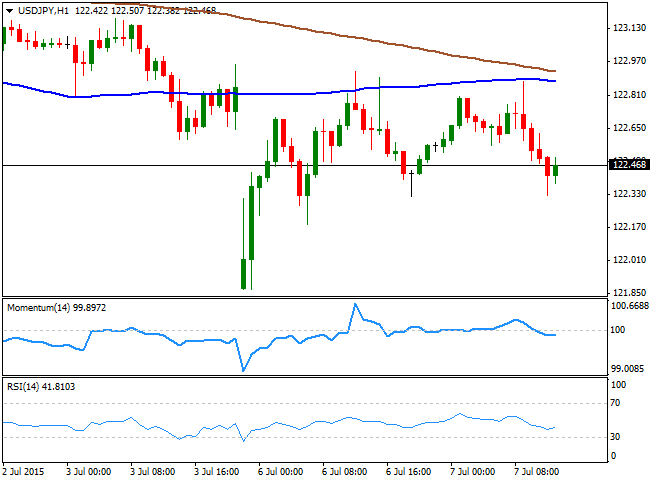
The Japanese Yen refuses to give up against the greenback, as safe-haven demand is also supporting the Asian currency. The USD/JPY pair trades near its daily low, established at 122.32, and unable to recover firmly above the current 122.45 region, a strong static resistance level. Intraday buying interest have been surging on dips towards the 122.00 region during the last sessions, but the bias is negative for the pair, as the 1 hour chart shows that the price was once again rejected from its 100 SMA in the hourly chart, currently around 122.90, whilst the technical indicators lack directional strength in negative territory. In the 4 hours chart, the 100 SMA continues widening the distance with the 200 SMA, both well above the current levels, whilst the technical indicators head lower below their mid-lines, supporting a stronger downward acceleration on a break below 122.00, towards the 100 DMA, today around 121.20.
Support levels: 122.00 121.60 121.20
Resistance levels: 122.45 122.95 123.30
AUD/USD Current price: 0.7429
View Live Chart for the AUD/USD
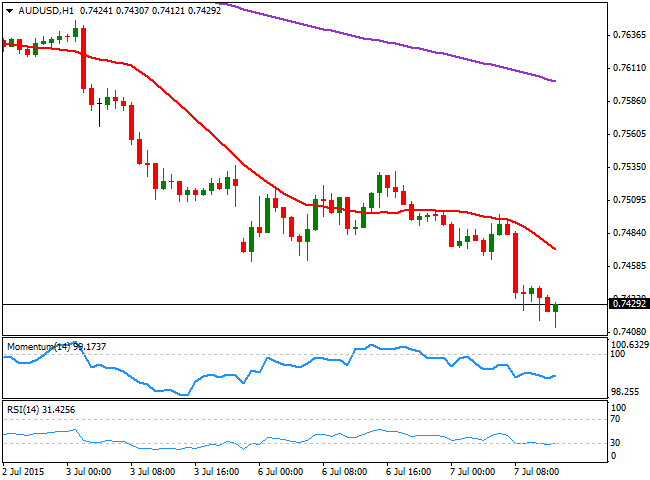
The Aussie extended its decline after the RBA left its economic policy unchanged, sending the AUD/USD pair to a fresh multi-year low of 0.7412. The pair remains under strong selling pressure, weighed also by the decline in metals, and the 1 hour chart shows that the 20 SMA has extended its decline further above the current price, whilst the technical indicators are posting tepid bounces from oversold levels. In the 4 hours chart, the RSI indicator maintains its bearish slope around 27, limiting chances of an upward corrective movement.
Support levels: 0.7410 0.7370 0.7330
Resistance levels: 0.7460 0.7500 0.7545
Recommended Content
Editors’ Picks
USD/JPY holds above 155.50 ahead of BoJ policy announcement

USD/JPY is trading tightly above 155.50, off multi-year highs ahead of the BoJ policy announcement. The Yen draws support from higher Japanese bond yields even as the Tokyo CPI inflation cooled more than expected.
AUD/USD extends gains toward 0.6550 after Australian PPI data

AUD/USD is extending gains toward 0.6550 in Asian trading on Friday. The pair capitalizes on an annual increase in Australian PPI data. Meanwhile, a softer US Dollar and improving market mood also underpin the Aussie ahead of the US PCE inflation data.
Gold price keeps its range around $2,330, awaits US PCE data

Gold price is consolidating Thursday's rebound early Friday. Gold price jumped after US GDP figures for the first quarter of 2024 missed estimates, increasing speculation that the Fed could lower borrowing costs. Focus shifts to US PCE inflation on Friday.
Stripe looks to bring back crypto payments as stablecoin market cap hits all-time high

Stripe announced on Thursday that it would add support for USDC stablecoin, as the stablecoin market exploded in March, according to reports by Cryptocompare.
US economy: Slower growth with stronger inflation

The US Dollar strengthened, and stocks fell after statistical data from the US. The focus was on the preliminary estimate of GDP for the first quarter. Annualised quarterly growth came in at just 1.6%, down from the 2.5% and 3.4% previously forecast.


