EUR/USD Current price: 1.0877
View Live Chart for the EUR/USD

The American dollar staged a strong comeback last Thursday, erasing all of its weekly losses against most of its rivals. Nevertheless, the fate of the greenback has not yet been defined, as it stands far from its year highs posted earlier this March. Hopes the FED will raise rates in June, got diluted after the latest Central Bank meeting, with weak US macroeconomic data reinforcing the idea of a delay: stocks soared, helped also by ECB's QE, and the greenback took a dive. But so far, the movement seems mostly corrective, and a bottom has not been yet confirmed.
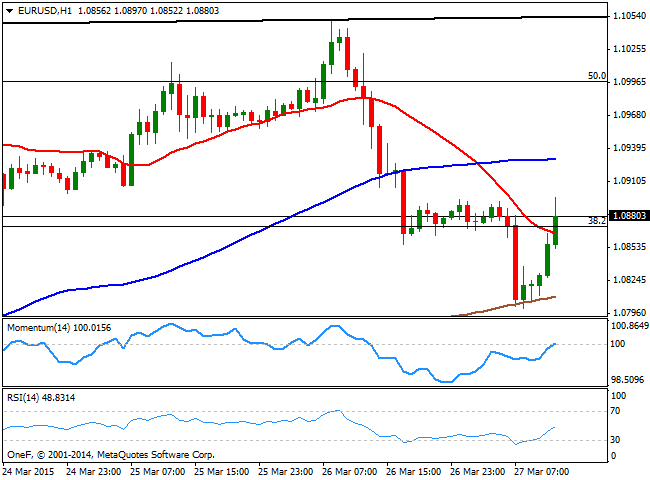
After the US GDP release, the EUR/USD pair trades above the 1.0865 level 38.2% retracement of its latest bearish run, with the short term picture showing that the indicators remain below their midlines and the price below aiming to advance above the 20 SMA, having found some short term buyers around the 200 SMA. Having established a daily low at 1.0800, a break through the level should lead to a downward continuation, with the immediate support at 1.0760, followed then by 1.0710, 23.6% retracement of the same rally. Above 1.0865 the pair can advance up to 1.0900, and above towards 1.0950, with sellers probably surging around this last.
Support levels: 1.0800 1.0760 1.0710
Resistance levels: 1.0865 1.0900 1.0950
GBP/USD Current price: 1.4889
View Live Chart for the GBP/USD

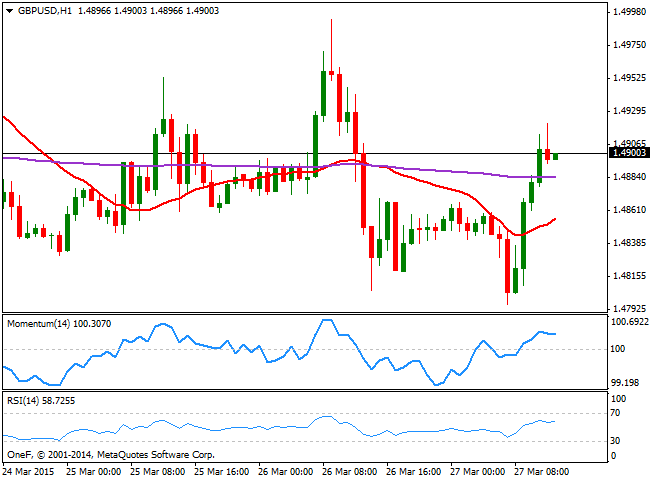
The GBP/USD pair recovered from a fresh weekly low of 1.4796, up to the 1.4900 area, consolidating around it after US GDP final Q4 reading printed 2.2%. The 1 hour chart shows that the price extended above its 20 SMA that now aims slightly higher around 1.4840, whilst the technical indicators are losing their upward strength, but holding in positive territory. In the 4 hours chart the pair maintains a mild negative tone, as the price moves back and forth around a bearish 20 SMA, whilst the technical indicators turned lower below their midlines. The pair has an immediate resistance level at 1.4920, with a break above it exposing 1.4950. Above this last, the pair may attempt to retest the 1.5000 level, but selling interest around it has been quite strong lately, limiting chances of further advances. Below 1.4870 on the other hand, the pair may likely resume the downside, eyeing then a retest of the daily low.
Support levels: 1.4870 1.4840 1.4800
Resistance levels: 1.4920 1.4950 1.5000
USD/JPY Current price: 119.14
View Live Chart for the USD/JPY
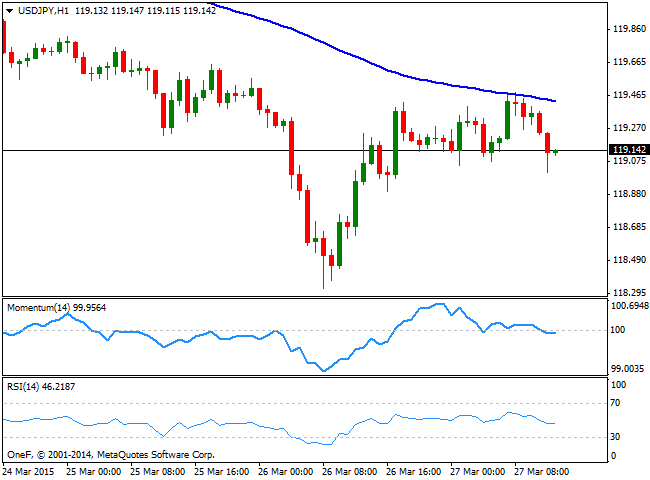
The USD/JPY remained capped below the 119.65 price zone, a strong static resistance level, maintaining an overall negative tone in the short term. The 1 hour chart shows that the price retraces from its 100 SMA that maintains a strong bearish slope around 119.40, whilst the technical indicators are crossing their midlines to the downside, supporting additional short term declines. In the 4 hours chart indicators are now turning south well below their midlines after correcting oversold levels, supporting the shorter term view. The pair will get some relief only with a steady recovery above the 120.00 level, whilst the bearish potential will likely resume on a break below the 118.70 support.
Support levels: 119.05 118.70 118.30
Resistance levels: 119.65 120.00 120.40
AUD/USD Current price: 0.7796
View Live Chart for the AUD/USD
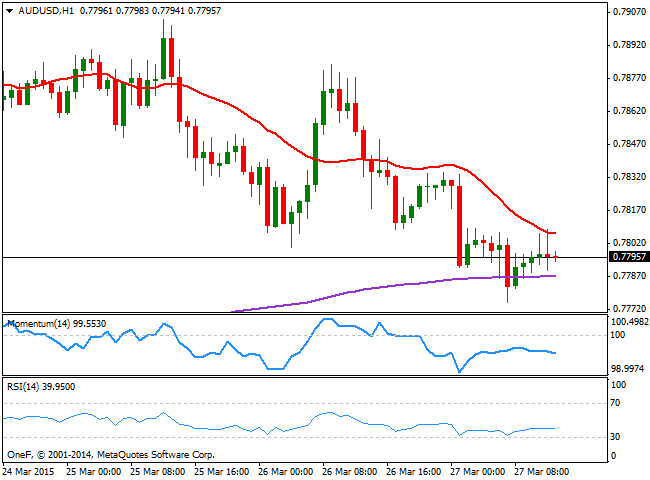
The AUD/USD pair trades lower in range this Friday, having found short term buyers around the 0.7770 area. The dominant bearish trend seems ready to resume, as the 1 hour chart shows that the price develops below a bearish 20 SMA, whilst the indicators gain tepid bearish slopes below their midlines. In the 4 hours chart the price holds above its 200 EMA a key midterm dynamic support, but stands below a bearish 20 SMA now around 0.7850, whilst the technical indicators head lower below their midlines. A downward acceleration below 0.7770 is required to confirm further intraday declines, whilst selling interest will likely surge on approaches to the 0.7880/0.7900 price zone, once the dust settles.
Support levels: 0.7800 0.7770 0.7725
Resistance levels: 0.7810 0.7850 0.7890
Recommended Content
Editors’ Picks
USD/JPY holds above 155.50 ahead of BoJ policy announcement

USD/JPY is trading tightly above 155.50, off multi-year highs ahead of the BoJ policy announcement. The Yen draws support from higher Japanese bond yields even as the Tokyo CPI inflation cooled more than expected.
AUD/USD extends gains toward 0.6550 after Australian PPI data

AUD/USD is extending gains toward 0.6550 in Asian trading on Friday. The pair capitalizes on an annual increase in Australian PPI data. Meanwhile, a softer US Dollar and improving market mood also underpin the Aussie ahead of the US PCE inflation data.
Gold price keeps its range around $2,330, awaits US PCE data

Gold price is consolidating Thursday's rebound early Friday. Gold price jumped after US GDP figures for the first quarter of 2024 missed estimates, increasing speculation that the Fed could lower borrowing costs. Focus shifts to US PCE inflation on Friday.
Stripe looks to bring back crypto payments as stablecoin market cap hits all-time high

Stripe announced on Thursday that it would add support for USDC stablecoin, as the stablecoin market exploded in March, according to reports by Cryptocompare.
US economy: Slower growth with stronger inflation

The US Dollar strengthened, and stocks fell after statistical data from the US. The focus was on the preliminary estimate of GDP for the first quarter. Annualised quarterly growth came in at just 1.6%, down from the 2.5% and 3.4% previously forecast.