EUR/USD Current price: 1.1117
View Live Chart for the EUR/USD

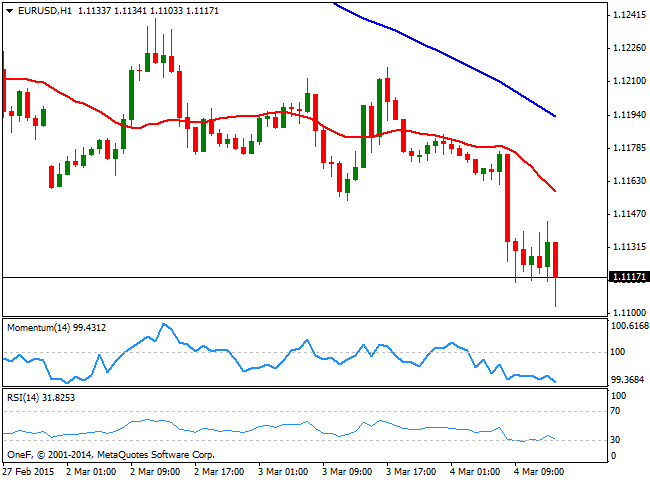
The EUR/USD pair traded as low as 1.1103 this Wednesday, weighed by worse than expected Services PMI in the Euro area, and looming ECB meeting this Thursday. The US ADP private survey said the country added 212K new jobs last February, slightly below the 220K expected, and with January reading reviewed to the upside, up to 250K. Early in the US session, the pair trades near the mentioned low, with 1.1150 capping the upside, and the 1 hour chart showing that the price holds below a bearish 20 SMA, whilst indicators turned flat after correcting oversold readings. In the 4 hours chart the bearish tone has lost downward momentum, but is far from signaling a change in the dominant bearish trend. The market may remain on hold ahead of tomorrow's ECB decision, furthermore considering the Central Bank is expected to shed light on the QE program expected to be launched as soon as next week.
Support levels: 1.1095 1.1050 1.1010
Resistance levels: 1.115 1.1180 1.1230
GBP/USD Current price: 1.5378
View Live Chart for the GBP/USD
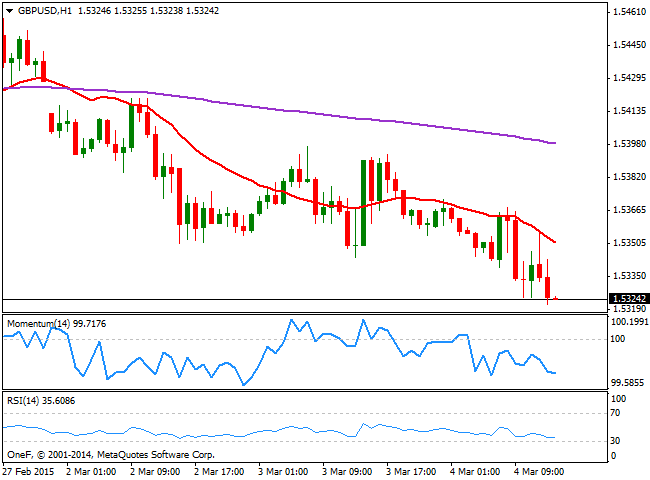
The GBP/USD pair trades near a three-week low of 1.5315 posted mid February, with a heavy bearish tone as per dollar broad strength against its European rivals. The 1 hour chart shows a strong bearish momentum coming from technical readings as the price extends further below a bearish 20 SMA whilst indicators accelerate lower below their midlines. In the 4 hours chart the price is sliding further below its 200 EMA, while the technical indicators gained bearish strength well below their midlines, supporting additional declines in the short term.
Support levels: 1.5315 1.5280 1.5250
Resistance levels: 1.5340 1.5385 1.5420
USD/JPY Current price: 119.55
View Live Chart for the USD/JPY
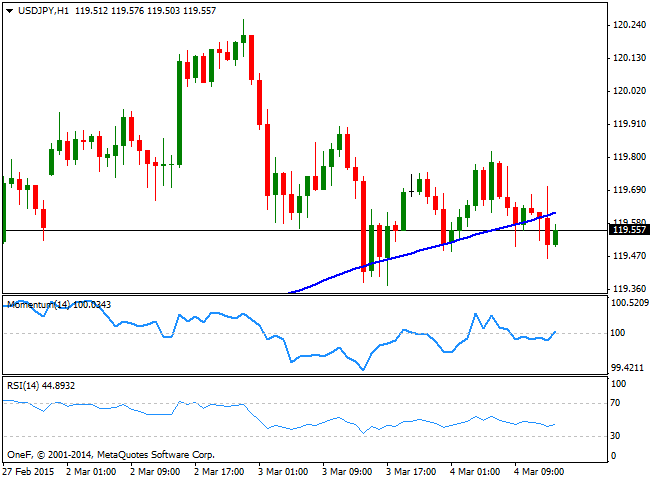
The USD/JPY pair continues to trade range bound, finding short term buyers around the 119.40 price zone. The 1 hour chart shows that the pair trades below its 100 SMA, while the technical indicators aim higher around their midlines, lacking directional strength at the time being. In the 4 hours chart the price holds well above its moving averages but the technical indicators head lower below their midlines, keeping the risk towards the downside. Nevertheless, the pair will likely continue to hold in range ahead of US monthly employment figures.
Support levels: 119.40 119.10 118.80
Resistance levels: 119.95 120.45 120.90
AUD/USD Current price: 0.7841
View Live Chart for the AUD/USD
The Australian dollar advanced up to 0.7859 against its American rival, with the pair maintaining its intraday gains. The 1 hour chart shows that the price holds above a flat 20 SMA while the technical indicators are turning south above their midlines. In the 4 hours chart the technical picture favors the upside as the indicators head higher above their midlines whilst the 20 SMA offers intraday support around 0.7800.
Support levels: 0.7800 0.7755 0.7720
Resistance levels: 0.7840 0.7890 0.7925
Recommended Content
Editors’ Picks

GBP/USD rises above 1.3300 after UK Retail Sales data
GBP/USD trades with a positive bias for the third straight day on Friday and hovers above the 1.3300 mark in the European morning on Friday. The data from the UK showed that Retail Sales rose at a stronger pace than expected in August, supporting Pound Sterling.

USD/JPY keeps BoJ-led losses below 142.50, Ueda's presser eyed
USD/JPY remains in the red below 142.50 after the Bank of Japan announced on Friday that it maintained the short-term rate target in the range of 0.15%-0.25%, as widely expected. Governor Ueda's press conference is next in focus.

Gold consolidates weekly gains, with sight on $2,600 and beyond
Gold price is looking to build on the previous day’s rebound early Friday, consolidating weekly gains amid the overnight weakness in the US Dollar alongside the US Treasury bond yields. Traders now await the speeches from US Federal Reserve monetary policymakers for fresh hints on the central bank’s path forward on interest rates.

Shiba Inu is poised for a rally as price action and on-chain metrics signal bullish momentum
Shiba Inu remains strong on Friday after breaking above a symmetrical triangle pattern on Thursday. This breakout signals bullish momentum, further bolstered by a rise in daily new transactions that suggests a potential rally in the coming days.

Bank of Japan set to keep rates on hold after July’s hike shocked markets
The Bank of Japan is expected to keep its short-term interest rate target between 0.15% and 0.25% on Friday, following the conclusion of its two-day monetary policy review. The decision is set to be announced during the early Asian session.

Moneta Markets review 2024: All you need to know
VERIFIED In this review, the FXStreet team provides an independent and thorough analysis based on direct testing and real experiences with Moneta Markets – an excellent broker for novice to intermediate forex traders who want to broaden their knowledge base.