EUR/USD Current price: 1.1345
View Live Chart for the EUR/USD
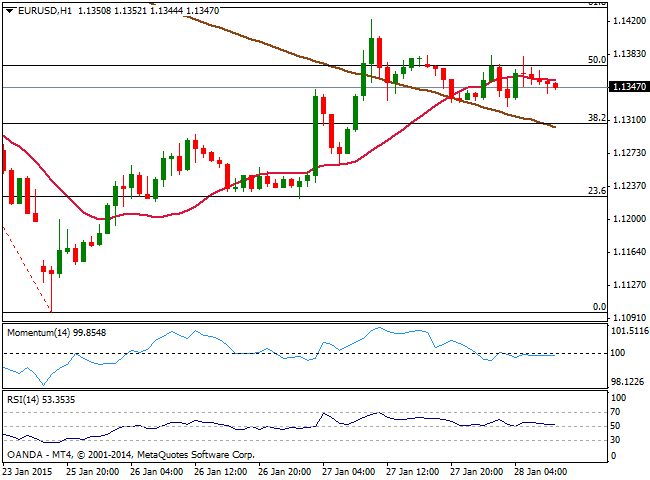
The EUR/USD pair trades in a quite tight range this Wednesday, capped by 1.1365, 50% retracement of the latest daily slide following ECB QE announcement. The US Federal Reserve will release a statement of its first 2015 meeting later today, and despite no surprise is expected, neither a press conference, market is on hold ahead of it. The short term picture is pretty neutral, with the price around a flat 20 SMA and indicators horizontal around their midlines, giving not much clues on where the market strength is. In the 4 hours chart indicators also lost directional strength, with momentum well into positive territory and the 20 SMA heading higher below the current price. The pair has been trading within Fibonacci levels for most of this last 2 days, with the 38.2% retracement of the above mentioned rally offering support at 1.1305, and the 61.8% at 1.1440, probable bullish target in the case of a major disappointment.
Support levels: 1.1305 1.1250 1.1210
Resistance levels: 1.1365 1.1400 1.1440
GBP/USD Current price: 1.5185
View Live Chart for the GBP/USD
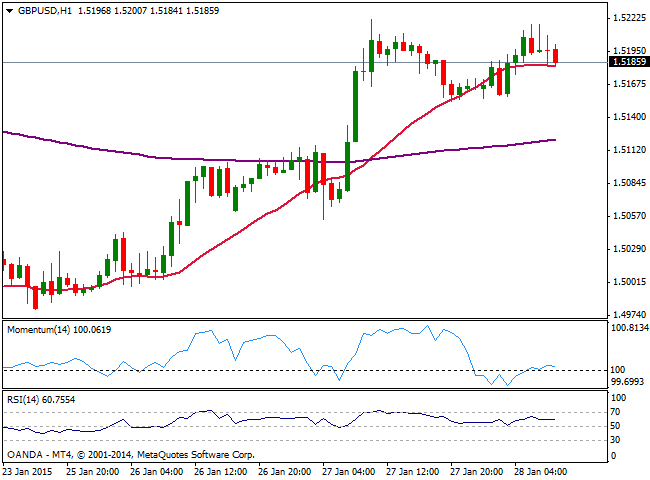
The GBP/USD pair eased some after failing to overcome the weekly high of 1.5224, although remains near the 1.5200 level, presenting a short term neutral stance as per the lack of volume across the forex board. The 1 hour chart shows that the price is pressuring a flat 20 SMA, while indicators lack directional strength in neutral territory. In the 4 hours chart the pair maintains the positive tone seen on previous updates, with indicators aiming higher after a mild correction from overbought levels, whilst 20 SMA heads higher around 1.5100. The upside remains favored, albeit a break through the mentioned high is required to confirm further advances.
Support levels: 1.5170 1.5125 1.5080
Resistance levels: 1.5225 1.5265 1.5300
USD/JPY Current price: 117.74
View Live Chart for the USD/JPY
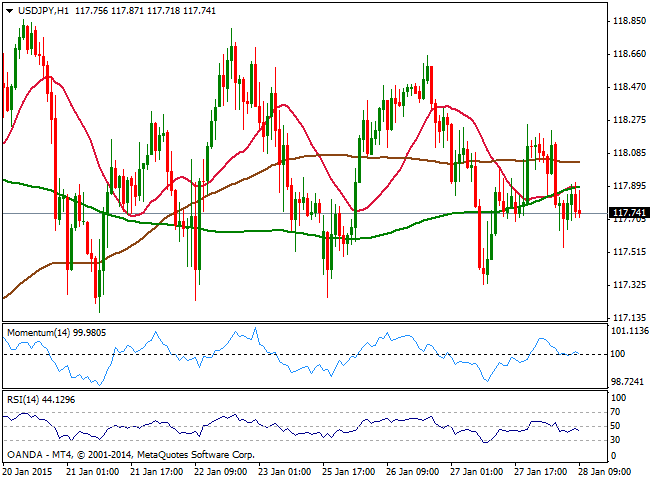
The USD/JPY pair trades slightly lower in the day, capped by a bearish 20 SMA in the daily chart, and with the short term picture favoring the downside, as despite indicators stand in neutral territory, the price develops below its moving averages. As commented on previous updates, the pair trades in a quite clear range between 117.00 and 118.80, and it will take a clear break of any of those extremes to set a clearer trend.
Support levels: 117.60 117.30 117.00
Resistance levels: 118.00 118.40 118.90
AUD/USD Current price: 0.7967
View Live Chart of the AUD/USD
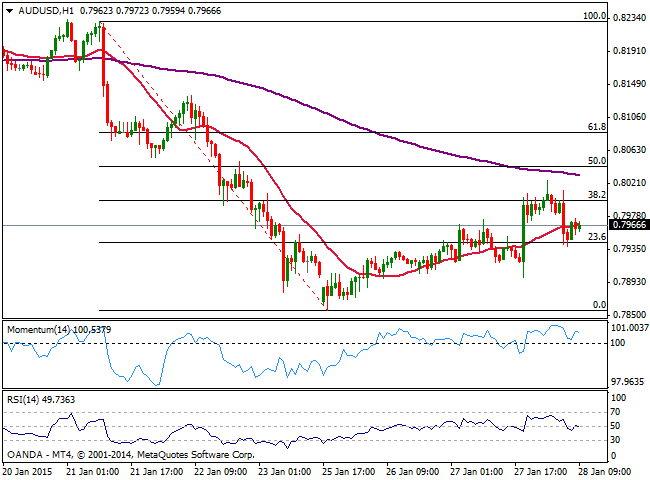
Better than expected Australian CPI figures boosted AUD/USD up to 0.8024 this Wednesday, although the pair was unable to hold gains above the 0.8000 mark, and eased back to 0.7940. The 1 hour chart shows that the price struggles around a bullish 20 SMA whilst indicators remain above their midlines. In the 4 hours chart momentum indicator is losing its early strength, turning south but still above 100, while 20 SMA stands flat a few pips below the mentioned daily low. The pair has been unable to advance above the 38.2% retracement of the latest daily fall, suggesting latest upward corrective move may be complete. To resume the downside however, the pair would need to break below the 0.7900 level.
Support levels: 0.7935 0.7900 0.7860
Resistance levels: 0.8000 0.8040 0.8080
Recommended Content
Editors’ Picks
USD/JPY holds above 155.50 ahead of BoJ policy announcement

USD/JPY is trading tightly above 155.50, off multi-year highs ahead of the BoJ policy announcement. The Yen draws support from higher Japanese bond yields even as the Tokyo CPI inflation cooled more than expected.
AUD/USD extends gains toward 0.6550 after Australian PPI data

AUD/USD is extending gains toward 0.6550 in Asian trading on Friday. The pair capitalizes on an annual increase in Australian PPI data. Meanwhile, a softer US Dollar and improving market mood also underpin the Aussie ahead of the US PCE inflation data.
Gold price keeps its range around $2,330, awaits US PCE data

Gold price is consolidating Thursday's rebound early Friday. Gold price jumped after US GDP figures for the first quarter of 2024 missed estimates, increasing speculation that the Fed could lower borrowing costs. Focus shifts to US PCE inflation on Friday.
Stripe looks to bring back crypto payments as stablecoin market cap hits all-time high

Stripe announced on Thursday that it would add support for USDC stablecoin, as the stablecoin market exploded in March, according to reports by Cryptocompare.
US economy: Slower growth with stronger inflation

The US Dollar strengthened, and stocks fell after statistical data from the US. The focus was on the preliminary estimate of GDP for the first quarter. Annualised quarterly growth came in at just 1.6%, down from the 2.5% and 3.4% previously forecast.