EUR/USD Current price: 1.2609
View Live Chart for the EUR/USD
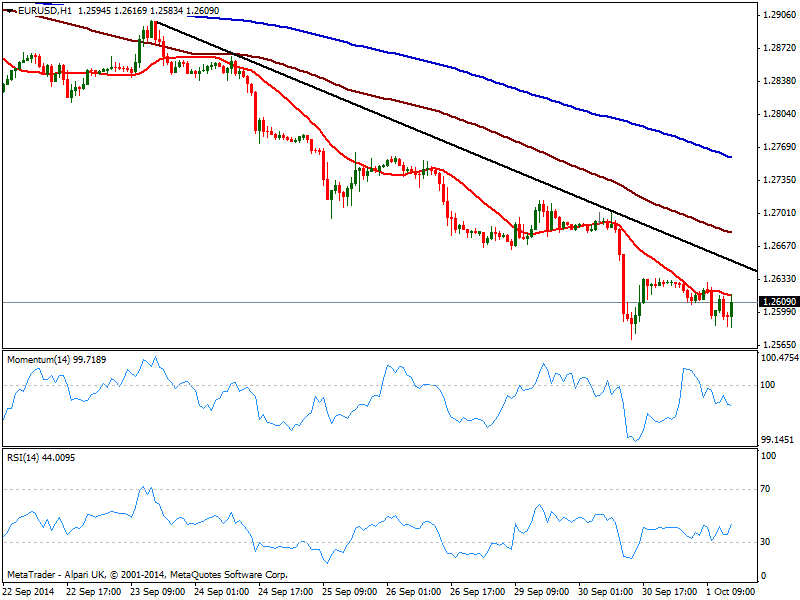
Amongst majors, yen was the only really active this Wednesday, and that’s because US indexes sunk: with no clear catalyst behind it, all three major indexes are down over 1% on the day, with DJIA having lost over 200 points, and the S&P getting dangerously close to 1900. But for the rest of the currencies it was an uneventful day, with traders waiting for upcoming ECB and NFP in these last days of the week. The EUR/USD has traded within 60 pips ahead of early Thursday ECB’s outcome of the latest economic policy decision. At this point, market is waiting for Mr. Draghi to backup its latest wording by launching more heavy armory to save Europe from deflation: just words, this time won’t be enough. So if he goes for a wait and see stance, the downward movement can resume strongly.
Technically, the 1 hour chart shows a quite neutral technical stance, with price around a mild bearish 20 SMA and indicators heading lower right below their midlines. In the 4 hours chart a daily descendant trend line coming from 1.2880 price zone caps the upside now around 1.6240 along with a bearish 20 SMA, while indicators head south below their midlines.
Support levels: 1.2570 1.2540 1.2510
Resistance levels: 1.2630 1.2650 1.2690
EUR/JPY Current price: 137.65
View Live Chart for the EUR/JPY
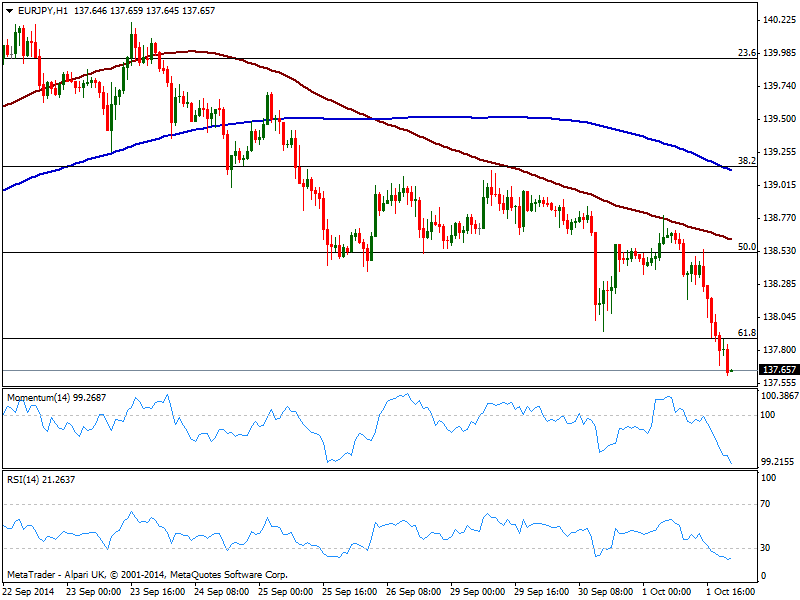
The EUR/JPY trades at its lowest in 3 weeks, with yen advancing strongly during the US session amid falling stocks. The 1 hour chart shows price extending below the 61.8% retracement of its latest bullish run, having been capped early Asian session by a bearish 100 SMA now around 138.60. Indicators in the same time frame maintain a clear bearish slope, standing in oversold territory, while the 4 hours chart shows an even stronger bearish momentum that supports a continued slide. Risk comes from ECB as market reaction is quite unpredictable over such big event, yet a recovery at least above 138.50 is required to support a recovery, while a price acceleration below 137.35 should see the pair approaching recent lows in the 136.40 price zone.
Support levels: 137.35 136.90 136.40
Resistance levels: 139.15 139.60 140.00
GBP/USD Current price: 1.6174
View Live Chart for the GBP/USD
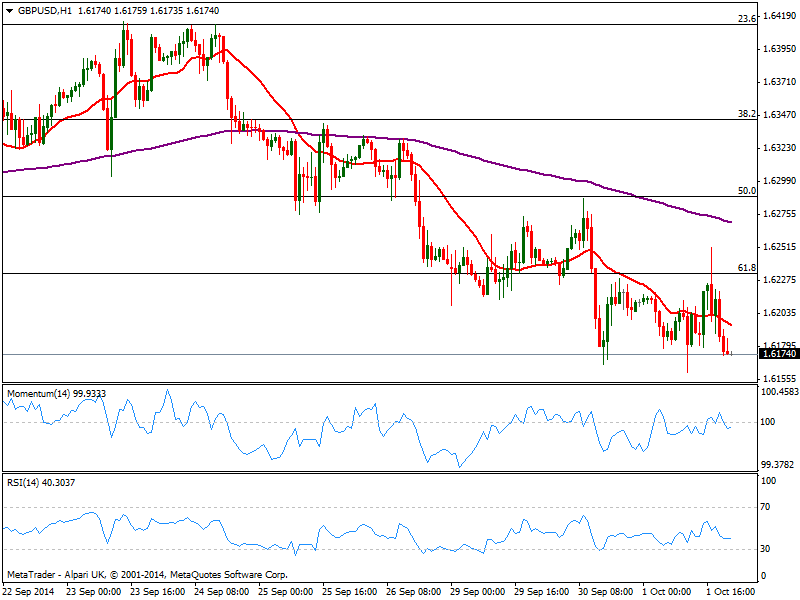
The GBP/USD trades near a fresh weekly low of 1.6161 posted last European session, on the back of a weaker than expected UK Manufacturing PMI reading. Despite dollar weakness against most rivals, the pair was unable to attract buyers, and maintains a mild negative tone as a new day starts: the 1 hour chart shows price below a bearish 20 SMA and indicators slightly lower below their midlines. In the 4 hours chart the bearish potential is a bit stronger, with 20 SMA now extending below the critical Fibonacci level at 1.6235 that anyway is the level to break to the upside, to deny a continued slide. A break below 1.6160 however, should fuel the slide towards 1.6085 as a probable daily target.
Support levels: 1.6160 1.6120 1.6085
Resistance levels: 1.6235 1.6260 1.6290
USD/JPY Current price: 109.20
View Live Chart for the USD/JPY
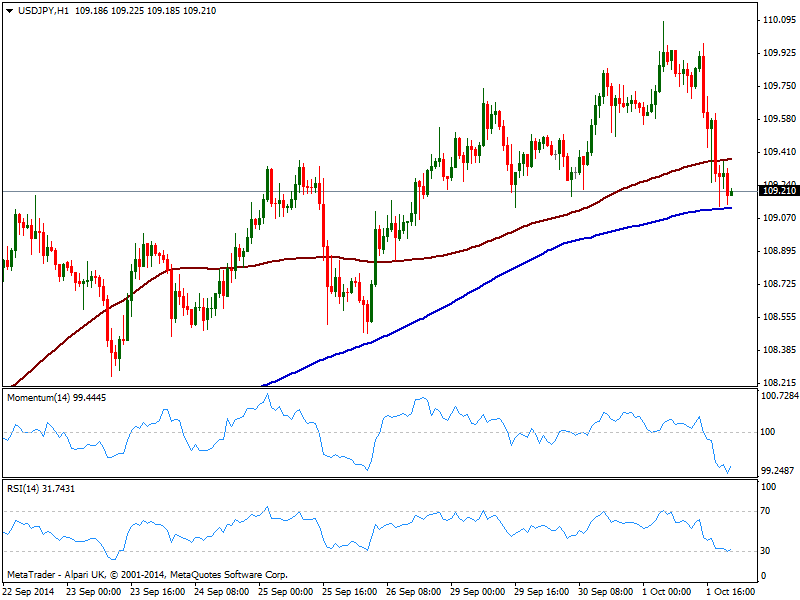
The USD/JPY lost almost 100 pips on the day, considering it post a fresh multi-year high of 110.08 past Asian session, on the back of a mixed Tankan report. The pair has succumbed to both, stocks and yields slides, as US 10Y notes lost around 10bp this Wednesday. The 1 hour chart shows price finding short term support at its 200 SMA around 109.10 while capped by 100 one in the 109.40 price zone. Indicators in the same time frame reached oversold levels and attempt a shy bounce, still deep in red. In the 4 hours chart indicators aim slightly higher after breaking below their midlines, with the overall tone still pointing for some more short slides, towards strong static support in the 108.50 price zone.
Support levels: 109.10 108.90 108.50
Resistance levels: 109.45 109.80 110.20
AUD/USD Current price: 0.8732
View Live Chart of the AUD/USD
The AUD/USD managed to recover most of its intraday losses, coming back from a fresh multi-month low of 0.8662. The 1 hour chart presents a mild bullish tone, with price above a flat 20 SMA and indicators aiming higher in positive territory, albeit price remains below 0.8760/70 area, immediate short term resistance. In the 4 hours chart, price struggles above a still bearish 20 SMA with indicators holding in neutral territory, showing no directional strength at the time being. A recovery beyond 0.8800 should signal an interim bottom in place, and a steadier recovery for the upcoming days.
Support levels: 0.8710 0.8680 0.8635
Resistance levels: 0.8765 0.8800 0.8840
Recommended Content
Editors’ Picks
USD/JPY holds above 155.50 ahead of BoJ policy announcement

USD/JPY is trading tightly above 155.50, off multi-year highs ahead of the BoJ policy announcement. The Yen draws support from higher Japanese bond yields even as the Tokyo CPI inflation cooled more than expected.
AUD/USD consolidates gains above 0.6500 after Australian PPI data

AUD/USD is consolidating gains above 0.6500 in Asian trading on Friday. The pair capitalizes on an annual increase in Australian PPI data. Meanwhile, a softer US Dollar and improving market mood also underpin the Aussie ahead of the US PCE inflation data.
Gold price keeps its range around $2,330, awaits US PCE data

Gold price is consolidating Thursday's rebound early Friday. Gold price jumped after US GDP figures for the first quarter of 2024 missed estimates, increasing speculation that the Fed could lower borrowing costs. Focus shifts to US PCE inflation on Friday.
Stripe looks to bring back crypto payments as stablecoin market cap hits all-time high

Stripe announced on Thursday that it would add support for USDC stablecoin, as the stablecoin market exploded in March, according to reports by Cryptocompare.
US economy: Slower growth with stronger inflation

The US Dollar strengthened, and stocks fell after statistical data from the US. The focus was on the preliminary estimate of GDP for the first quarter. Annualised quarterly growth came in at just 1.6%, down from the 2.5% and 3.4% previously forecast.