EUR/USD Current price: 1.3598
View Live Chart for the EUR/USD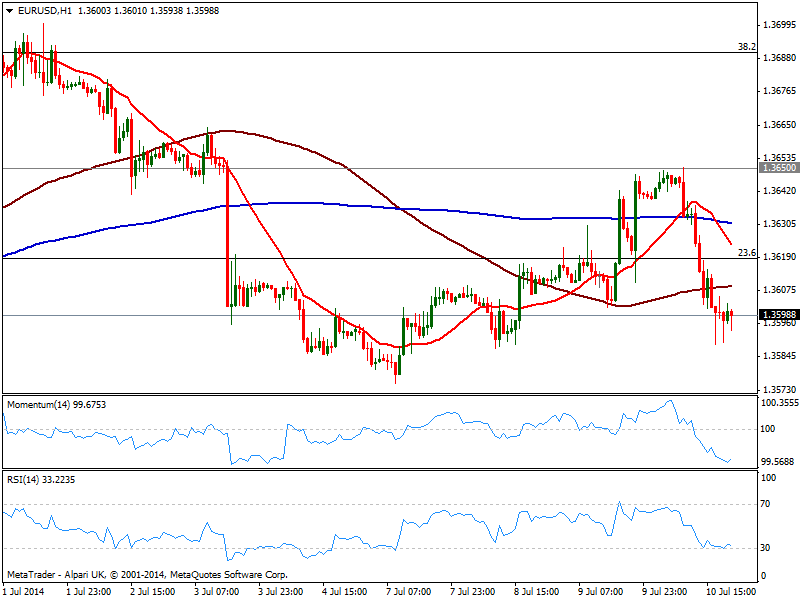
Dollar came back on Thursday, erasing all of its post FOMC losses against its rivals, except the yen. Risk aversion took over markets on worries over the financial health of a major Portuguese lender, Espirito Santo that drove down all major stock indexes both in Europe and the US. Weak European Industrial data also weighed on the common currency that closed the day right below the 1.3600 figure against the greenback. Furthermore, FED’s warning yesterday about investors been too complacent fueled some intraday profit taking in the stocks world triggering a strong demand of safe havens.
Technically, the EUR/USD downward potential remains limited by buying interest in the 1.3570 area, and as long as above it, range will prevail. The hourly chart shows indicators heading south below their midlines, starting to get exhausted near oversold readings but far from suggesting a reversal. In the 4 hours chart the picture is also slightly bearish, with a break below mentioned support favoring a run towards 1.3530 price zone.
Support levels: 1.3570 1.3530 13500
Resistance levels: 1.3620 1.3650 1.3680
EUR/JPY Current price: 137.74
View Live Chart for the EUR/JPY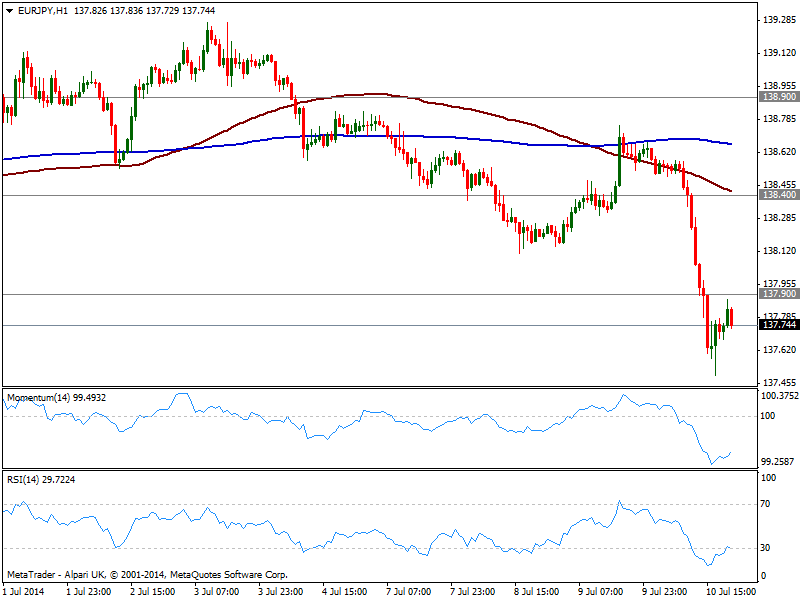
Yen soared all through the day, easing some by the end of the US session on recovering yields that bottomed intraday around 2.5%. Stocks tumbled and yen followed, but when stocks bounced back yen presented mild losses against most rivals, which keeps the risk of yen crosses to the downside. Technically, the pair extended down to 137.49, a few pips above last support possible, and closes the day below the 137.90 mark having been rejected from this last in an attempt to recover. The hourly chart shows indicators correcting higher form extreme oversold readings, but price seems unable to follow, while 100 SMA maintains a strong bearish slope well above current price. In the 4 hours chart the picture is pretty similar, with recoveries up to 138.40 seen as corrective now. A break below 137.40 on the other hand, exposes the pair to a continued slide, eyeing 136.60 for this Friday.
Support levels: 137.40 137.00 136.60
Resistance levels: 138.40 138.90 139.35
GBP/USD Current price: 1.7140
View Live Chart for the GBP/USD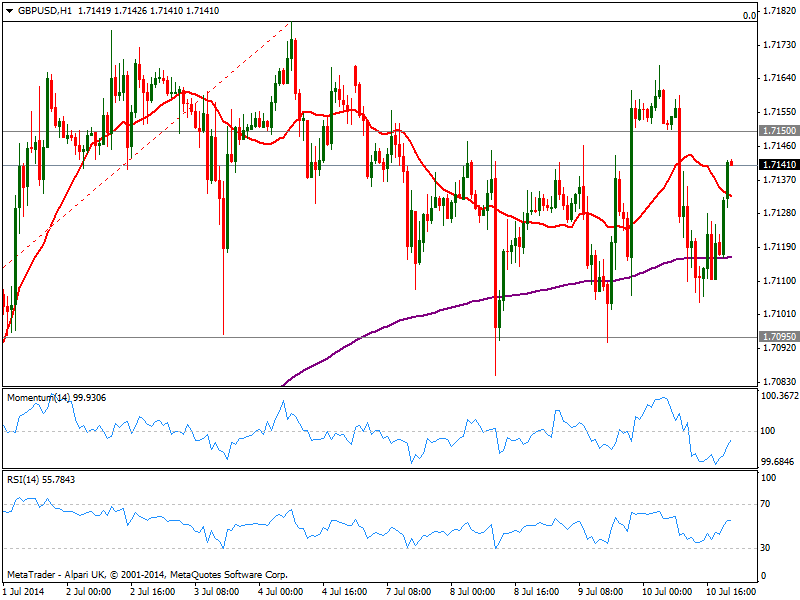
Another day for Pound to prove is the strongest currency of the board, as despite UK trade balance disappointed with a widening deficit, the GBP/USD ended the day barely 10 pips below its daily opening. The hourly chart shows buyers surged on approaches to the 1.7100 level, with indicators heading north still below their midlines as price stands now above its 20 SMA. In the 4 hours chart technical positive are mild bullish, but for the most neutral as per latest range. Nevertheless, the upside is still favored with a break above 1.7180 pointing for an upward continuation towards 1.7250 strong static resistance zone.
Support levels: 1.7095 1.7060 1.7020
Resistance levels: 1.7150 1.7180 1.7220
USD/JPY Current price: 101.25
View Live Chart for the USD/JPY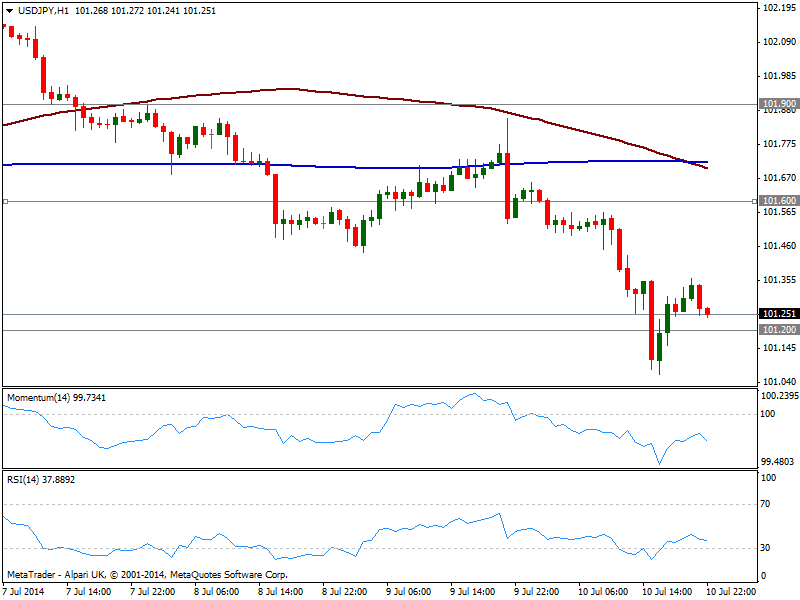
The USD/JPY managed to recover some ground after flirting with 101.00 early US session, maintaining anyway a strong bearish tone in the short and the midterm. The hourly chart shows 100 SMA crossing 200 one to the downside, both around 101.70 while indicators turned south below their midlines after correcting early oversold levels. In the 4 hours chart indicators aim higher also from oversold territory, still deep in negative territory and far from suggesting a recovery: price needs to advance at least above 101.60 to shrug off some of the bearish tone. Year lows around 100.70 are still eyed, with a break below it probably triggering large stops and fueling a selloff.
Support levels: 101.20 100.70 100.25
Resistance levels: 101.60 101.95 102.35
AUD/USD Current price: 0.9395
View Live Chart for the AUD/USD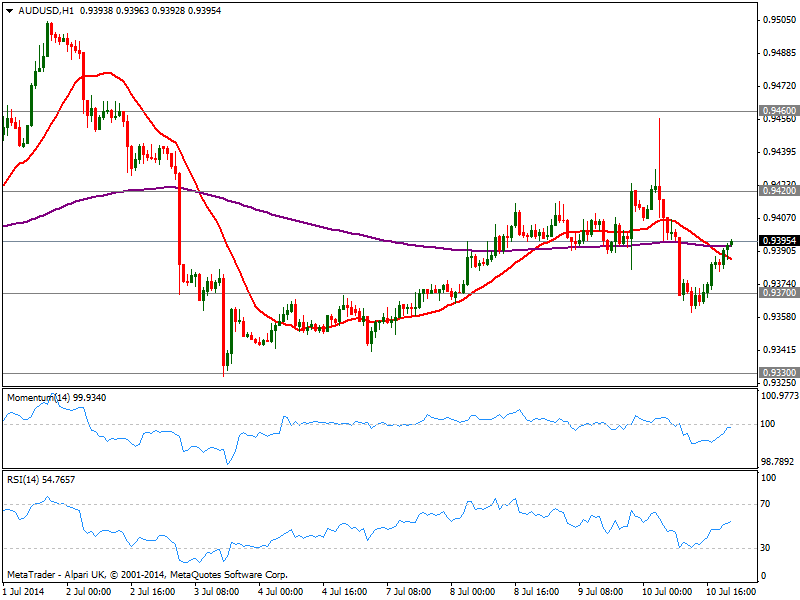
Aussie suffered more from local data than from dollar strength on Thursday, as the AUD/USD eased early Asia on the back of disappointing Australian employment figures, yet managed to end the day in the vicinity of the 0.9400 figure, supported by gold soaring to levels not seen since past March. The hourly chart shows price advancing above a still bearish 20 SMA , while indicators head higher and approach their midlines, not yet confirming an upward continuation. In the 4 hours chart price recovered from its 200 EMA usually a strong dynamic support/resistance, as indicators turn higher around their midlines, not showing enough upward strength just yet. A recovery above 0.9420 is what it takes to confirm a stronger advance, eyeing 0.9460 in the short term.
Support levels: 0.9370 0.9330 0.9300
Resistance levels: 0.9420 0.9460 0.9500
Recommended Content
Editors’ Picks
EUR/USD holds above 1.0700 ahead of key US data

EUR/USD trades in a tight range above 1.0700 in the early European session on Friday. The US Dollar struggles to gather strength ahead of key PCE Price Index data, the Fed's preferred gauge of inflation, and helps the pair hold its ground.
USD/JPY stays above 156.00 after BoJ Governor Ueda's comments

USD/JPY holds above 156.00 after surging above this level with the initial reaction to the Bank of Japan's decision to leave the policy settings unchanged. BoJ Governor said weak Yen was not impacting prices but added that they will watch FX developments closely.
Gold price oscillates in a range as the focus remains glued to the US PCE Price Index

Gold price struggles to attract any meaningful buyers amid the emergence of fresh USD buying. Bets that the Fed will keep rates higher for longer amid sticky inflation help revive the USD demand.
Sei Price Prediction: SEI is in the zone of interest after a 10% leap

Sei price has been in recovery mode for almost ten days now, following a fall of almost 65% beginning in mid-March. While the SEI bulls continue to show strength, the uptrend could prove premature as massive bearish sentiment hovers above the altcoin’s price.
US core PCE inflation set to signal firm price pressures as markets delay Federal Reserve rate cut bets

The core PCE Price Index, which excludes volatile food and energy prices, is seen as the more influential measure of inflation in terms of Fed positioning. The index is forecast to rise 0.3% on a monthly basis in March, matching February’s increase.