EUR/USD Current price: 1.0925
View Live Chart for the EUR/USD
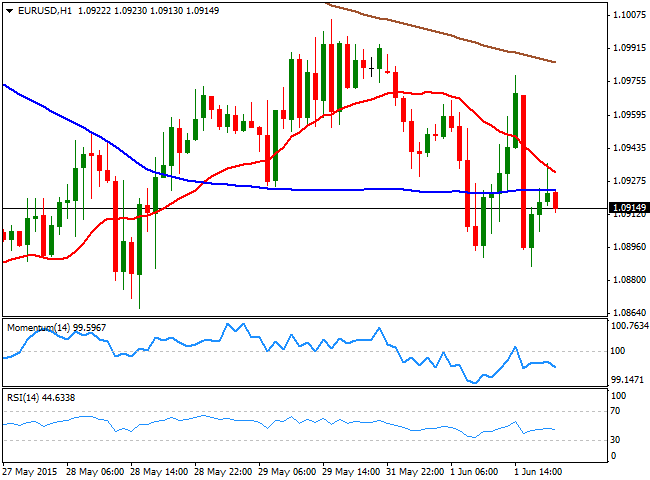
If something can be made out of market's Monday behavior, is that investors don't need much to buy the greenback. The lack of progress in Greek negotiations gave the American currency some support during the first half of the day, and despite steady signs of economic growth in Europe: Markit Manufacturing PMIs resulted for the most encouraging, although German and EU readings missed expectations for May. In Germany, inflation ticked higher in May, printing 0.1%. In the US, Personal Incomes rose beyond expected in May, albeit Spending resulted flat. PCE inflation, the FED's favorite one when it comes to taking decision, also missed slightly, sending the dollar temporally lower across the board, alongside with FED's officers down-talking a rate hike. But the latest US data release, the ISM Manufacturing PMI, came out at 52.8, sending the dollar to fresh daily highs against all of its rivals.
The Greek drama continues to undermine the common currency that trades a few pips above the 1.0900 level against the greenback by the end of the day. The technical picture favors the downside, as in the 1 hour chart, the price retreated back below its moving averages, whilst the technical indicators present a bearish slope in negative territory. In the 4 hours chart, the pair presents a more neutral technical stance, with the technical indicators lacking directional strength around their mid-lines, and the price hovering near a horizontal 20 SMA. Approaches to the 1.1000 level have attracted selling interest which means only a clear break above it will favor an upward continuation during the upcoming sessions.
Support levels: 1.0890 1.0850 1.0810
Resistance levels: 1.0950 1.1000 1.1050
EUR/JPY Current price: 136.28
View Live Chart for the EUR/JPY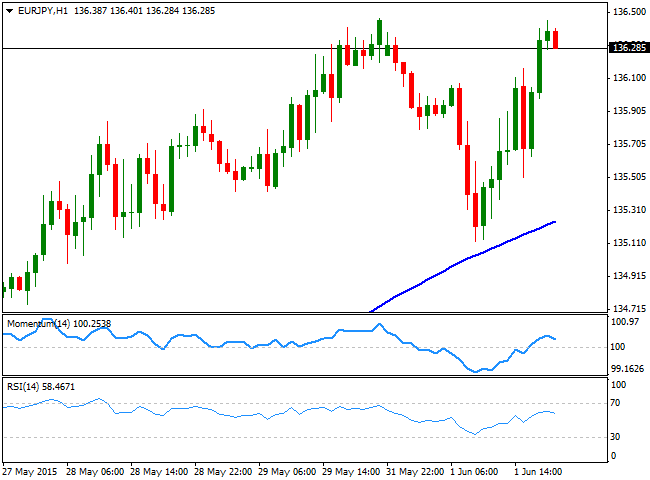
The EUR/JPY fell down to 135.12 intraday on the back of EUR self weakness, although a late strong slide in the Japanese yen during the American afternoon, forced the pair back higher, erasing most of its daily gains and back above the 136.00 level. The 1 hour chart shows that the price has recovered sharply on a first approach to its 100 SMA, currently offering a dynamic support around 135.20, whilst the technical indicators have advanced above their mid-lines, but are now losing their upward strength. In the 4 hours chart, the technical indicators corrected lower from overbought territory before bouncing back higher from their mid-lines, supporting additional gains, particularly on a break above 136.65, the immediate resistance level.
Support levels: 136.20 135.50 135.10
Resistance levels: 136.65 137.00 137.45
GBP/USD Current price: 1.5207
View Live Chart for the GBP/USD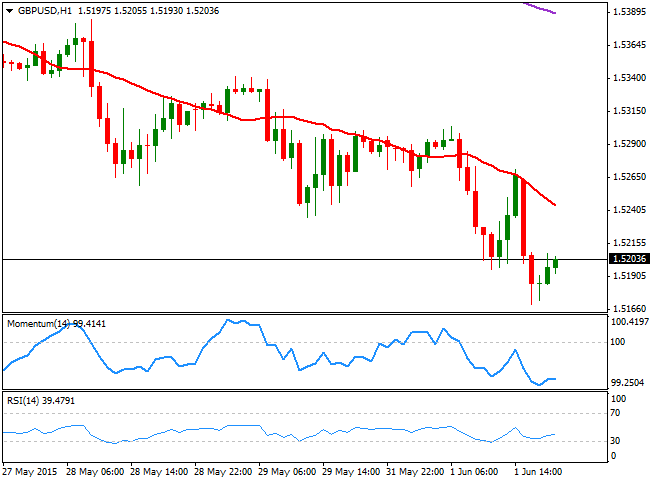
The GBP/USD pair ended the day around the 1.5200 level, after falling as low as 1.5169 intraday. The British Pound was weighed by a lower-than-expected UK manufacturing reading for May that resulted at 52.0 against expectations of 52.5, reflecting that the slower pace of expansion in the local economy extended beyond the first quarter. Later on this week, the Bank of England will have its monthly economic meeting, albeit no news are expected to be announced there. Technically, the 1 hour chart shows that the 20 SMA maintains a clear bearish slope above the current price, having capped the upside on an early attempt of recovery. The technical indicators in the mentioned time frame stand in negative territory, showing no directional strength at the time being. In the 4 hours chart, the 20 SMA also presents a strong bearish slope well above the current level, whilst the RSI indicator stands flat in oversold territory, and the Momentum indicator hovers in negative territory, supporting the shorter term outlook.
Support levels: 1.5170 1.5140 1.5110
Resistance levels: 1.5235 1.5260 1.5300
USD/JPY Current price: 124.81
View Live Chart for the USD/JPY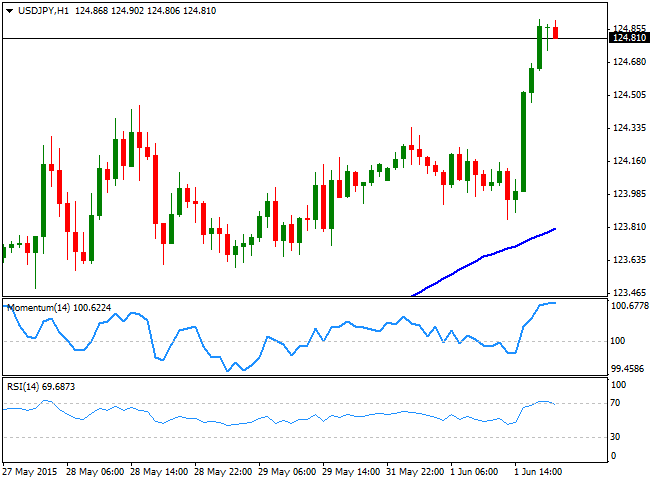
The USD/JPY pair surged to a fresh multi-year high of 124.91, consolidating a few pips below the level amid dollar renewed demand. FED officers spoke at the beginning of the American session, with Rosengren saying that the conditions to start tightening have not been reached yet, but it was not enough to spook USD/JPY buyers. The pair looks slightly overbought in the short term, as the technical indicators in the 1 hour chart are turning lower in overbought levels, albeit the 100 SMA maintains a strong bearish slope around 123.80, providing dynamic support in the case of a sudden reversal. In the 4 hours chart, however, the Momentum indicator recovered after testing its mid-line, whilst the RSI indicator continues to head north, despite being in overbought territory, around 74, all of which supports the dominant bullish trend.
Support levels: 123.65 123.30 122.90
Resistance levels: 124.45 124.85 125.10
AUD/USD Current price: 0.7607
View Live Chart for the AUD/USD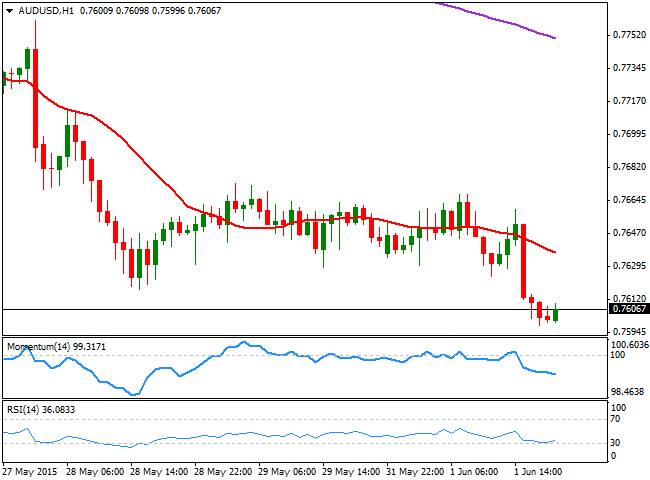
The AUD/USD pair fell briefly below the 0.7600 level posting a fresh 2-month low of 0.7598, and trades around it ahead of the upcoming RBA economic policy decision early Tuesday. The Australian dollar is under pressure ahead of the meeting, as the market expects Governor Glenn Stevens to return to a dovish stance, although no chances in the current policy are expected for today. The technical stance is bearish ahead of the decision, as the 1 hour chart shows that the price extended below its 20 SMA, whilst the Momentum indicator maintains a strong bearish slope below its 100 level, and the RSI hovers around 35. In the 4 hours chart the 20 SMA capped the upside during the past Asian session, now offering a dynamic intraday resistance around 0.7670, whilst the RSI indicator stands around 28 and the Momentum indicator lacks directional strength in negative territory. Overall, the upcoming direction is strongly correlated with the RBA outcome, yet a break below 0.7530, this year low, later on in the day, should trigger stops and fuel the slide in the short term, and at the same time open doors for an approach to the 0.7200 in the mid run.
Support levels: 0.7580 0.7530 0.7290
Resistance levels: 0.7630 0.7760 0.7715
Recommended Content
Editors’ Picks
USD/JPY jumps above 156.00 on BoJ's steady policy

USD/JPY has come under intense buying pressure, surging past 156.00 after the Bank of Japan kept the key rate unchanged but tweaked its policy statement. The BoJ maintained its fiscal year 2024 and 2025 inflation forecast, disappointing the Japanese Yen buyers.
AUD/USD consolidates gains above 0.6500 after Australian PPI data

AUD/USD is consolidating gains above 0.6500 in Asian trading on Friday. The pair capitalizes on an annual increase in Australian PPI data. Meanwhile, a softer US Dollar and improving market mood also underpin the Aussie ahead of the US PCE inflation data.
Gold price keeps its range around $2,330, awaits US PCE data

Gold price is consolidating Thursday's rebound early Friday. Gold price jumped after US GDP figures for the first quarter of 2024 missed estimates, increasing speculation that the Fed could lower borrowing costs. Focus shifts to US PCE inflation on Friday.
Stripe looks to bring back crypto payments as stablecoin market cap hits all-time high

Stripe announced on Thursday that it would add support for USDC stablecoin, as the stablecoin market exploded in March, according to reports by Cryptocompare.
US economy: Slower growth with stronger inflation

The US Dollar strengthened, and stocks fell after statistical data from the US. The focus was on the preliminary estimate of GDP for the first quarter. Annualised quarterly growth came in at just 1.6%, down from the 2.5% and 3.4% previously forecast.