EUR/USD Current price: 1.2685
View Live Chart for the EUR/USD
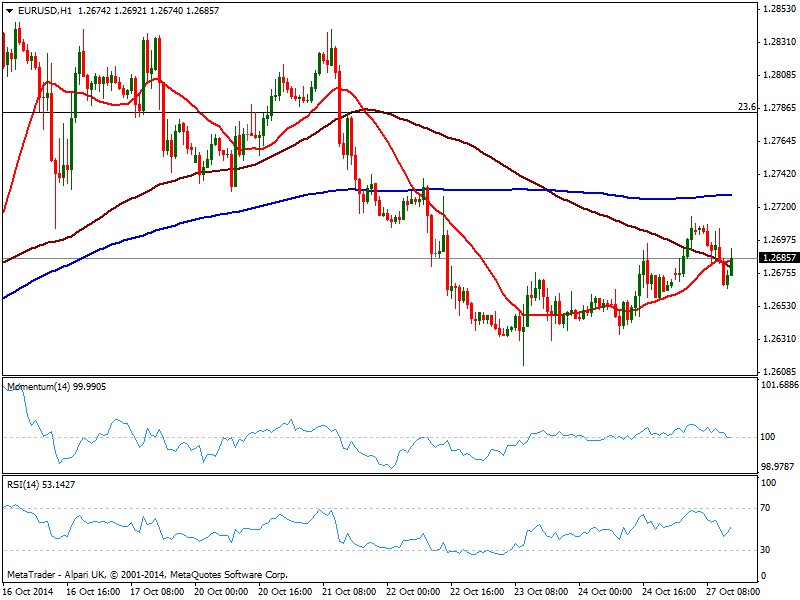
The EUR/USD trades a few pips above its weekly opening having been trading in a quite limited range so far today. With a daily high at 1.2713, the hourly chart presents a very limited positive tone, with price hovering around a bullish 20 SMA but indicators steady in neutral territory. In the 4 hours chart 20 SMA offered intraday support at 1.2665 while indicators lose upward potential above their midlines, showing the lack of interest, either side of the board in the pair at this point. With a hurdle of US data in less than an hour, levels to watch are 1.2650/60 to the downside and 1.2710 to the upside, as some follow through either side of such range is required to confirm some further directional strength.
Support levels: 1.2655 1.2620 1.2580
Resistance levels: 1.2710 1.2750 1.2790
GBP/USD Current price: 1.6115
View Live Chart for the GBP/USD
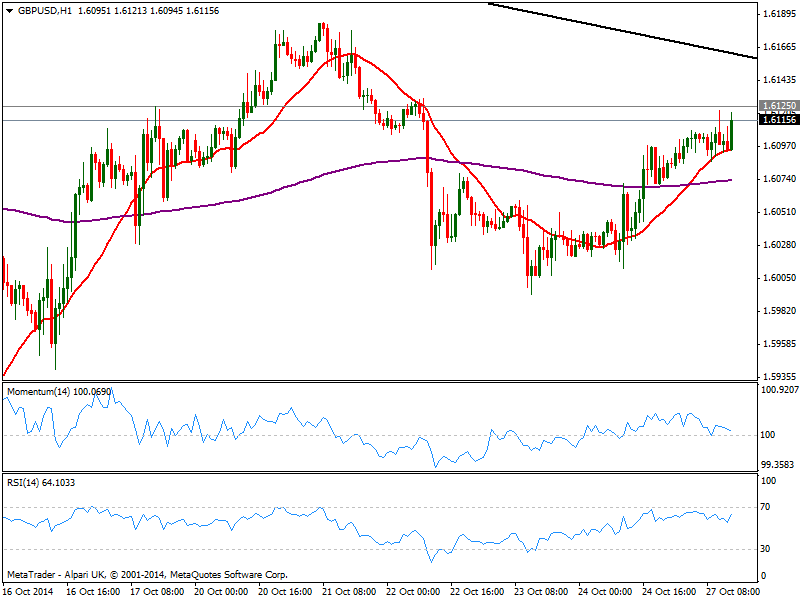
The GBP/USD advances slowly this Monday, approaching 1.6125 static resistance level, that already contained advances earlier on the day. The 1 hour chart shows 20 SMA containing the downside, flat around 1.6070, while indicators show little aims to move in neutral territory. In the 4 hours chart indicators gain bullish slope above their midlines, while price extends above its 20 SMA, supporting some further gains for the day: a break above the level should lead to an advance up to 1.6160, a daily descendant trend line coming from 1.7090.
Support levels: 1.6070 1.6030 1.5995
Resistance levels: 1.6125 1.6160 1.6200
USD/JPY Current price: 107.80
View Live Chart for the USD/JPY
The USD/JPY trades slightly lower alongside with stocks, with indexes in the US pointing for a strong slide and European ones accelerating south. Technically, the 1 hour chart shows indicators heading south below their midlines, while 100 SMA maintains a strong bullish slope in the 107.50/60 area, acting as immediate support. In the 4 hours chart indicators turned south but remain above their midlines, while price struggles with both 100 and 200 SMAs around current price, giving no much directional clues.
Support levels: 107.55 107.10 106.70
Resistance levels: 108.15 108.50 108.90
AUD/USD Current price: 0.8794
View Live Chart of the AUD/USD
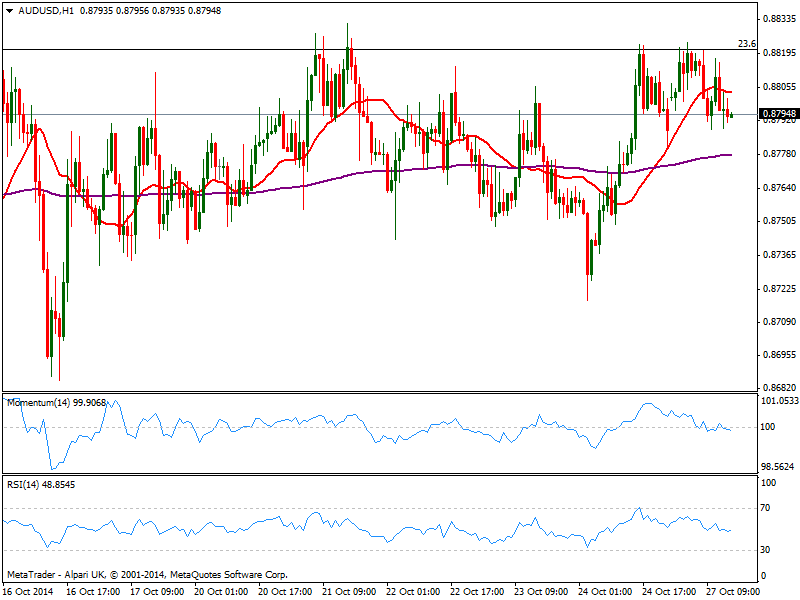
The AUD/USD trades uneventfully between 0.8770 and 0.8820 as usual, having tested the upper band of the range several times since the day started, yet still unable to break trough. The 1 hour chart shows indicators turning lower but in neutral territory, while 20 SMA lost its bullish slope, now flat around 0.8800. In the 4 hours chart the picture remains neutral and if something, falling stocks won’t help the pair break through the critical resistance.
Support levels: 0.8770 0.8730 0.8690
Resistance levels: 0.8820 0.8860 0.8900
Recommended Content
Editors’ Picks

EUR/USD advances toward 1.1200 on renewed US Dollar weakness
EUR/USD is extending gains toward 1.1200 on Friday, finding fresh demand near 1.1150. Risk sentiment improves and weighs on the US Dollar, allowing the pair to regain traction. The Greenback also reels from the pain of the dovish Fed outlook, with Fedspeak back on tap.

Gold price advances further beyond $2,600 mark, fresh record high
Gold price (XAU/USD) gains positive traction for the second successive day on Friday and advances to a fresh record high, beyond the $2,600 mark during the early European session.

USD/JPY recovers to 143.00 area during BoJ Governor Ueda's presser
USD/JPY stages a recovery toward 143.00 in the European morning following the initial pullback seen after the BoJ's decision to maintain status quo. In the post-meeting press conference, Governor Ueda reiterated that they will adjust the degree of easing if needed.

Shiba Inu is poised for a rally as price action and on-chain metrics signal bullish momentum
Shiba Inu remains strong on Friday after breaking above a symmetrical triangle pattern on Thursday. This breakout signals bullish momentum, further bolstered by a rise in daily new transactions that suggests a potential rally in the coming days.

Bank of Japan set to keep rates on hold after July’s hike shocked markets
The Bank of Japan is expected to keep its short-term interest rate target between 0.15% and 0.25% on Friday, following the conclusion of its two-day monetary policy review. The decision is set to be announced during the early Asian session.

Moneta Markets review 2024: All you need to know
VERIFIED In this review, the FXStreet team provides an independent and thorough analysis based on direct testing and real experiences with Moneta Markets – an excellent broker for novice to intermediate forex traders who want to broaden their knowledge base.