EUR/USD Current price: 1.3592
View Live Chart for the EUR/USD
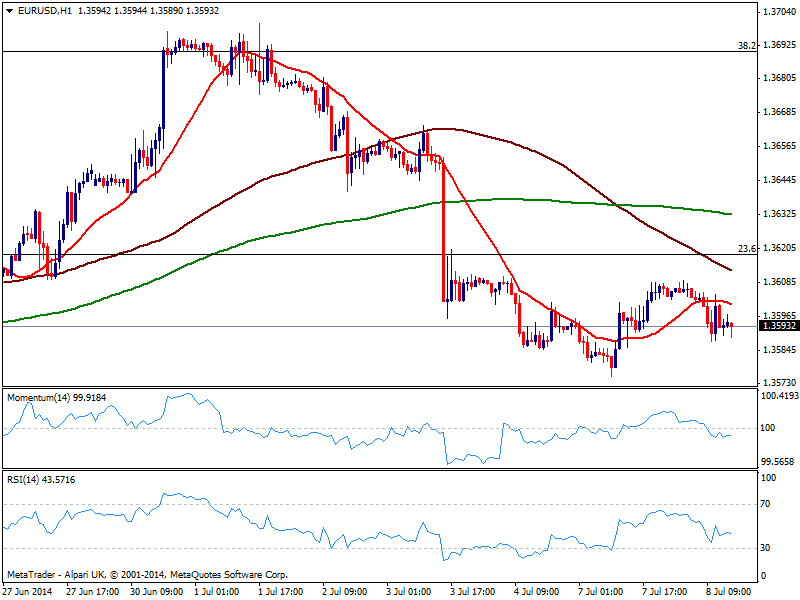
Having shown no progress over Asian or European hours, the EUR/USD has lost some ground ahead of US opening, down from a daily high of 1.3609. The hourly chart shows a mild bearish tone with price below its 20 SMA while indicators hold below their midlines mostly flat and directionless. In the 4 hours chart price continues developing below moving averages all of them converging in a tight 10 pips range, which clearly reflects the lack of direction in the pair. As commented on previous updates, stops are likely large below the 1.3570, and if trigger the pair may extend its slide towards the 1.3500/30 price zone.
Support levels: 1.3570 1.3530 1.3500
Resistance levels: 1.3620 1.3675 1.3700
GBP/USD Current price: 1.7117
View Live Chart for the GBP/USD
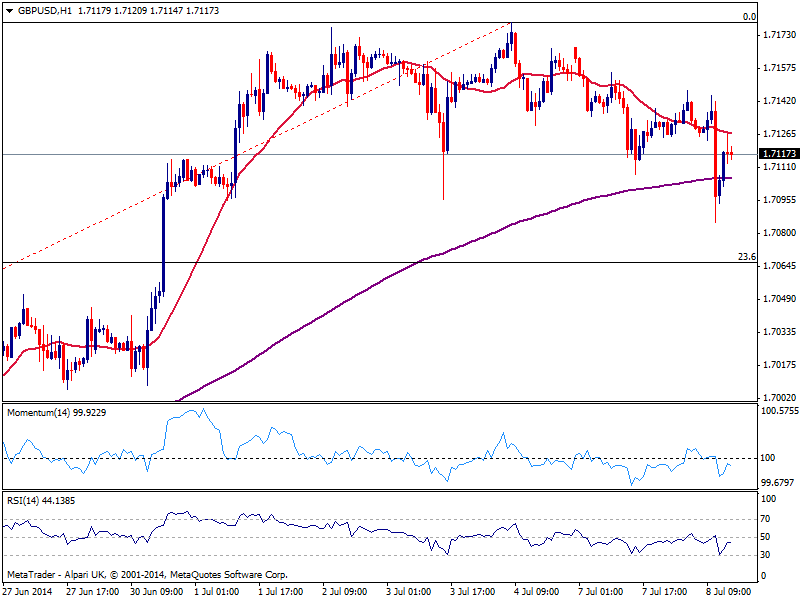
Pound suffered from worse than expected data down to 1.7085 on the day against the dollar. Buyers however took their chances and price recovered above the 1.7100 figure, still unable to confirm a break higher in the short term, as per the hourly chart showing price capped below a bearish 20 SMA and indicators heading lower below their midlines. In the 4 hours chart technical readings present a strong bearish tone, with price below its 20 SMA and indicators heading south into negative territory. Nevertheless risk to the downside is being limited by 1.7060, 23.6% retracement of the latest daily bullish run.
Support levels: 1.7095 1.7060 1.7020
Resistance levels: 1.7130 1.7180 1.7220
USD/JPY Current price: 101.70
View Live Chart for the USD/JPY
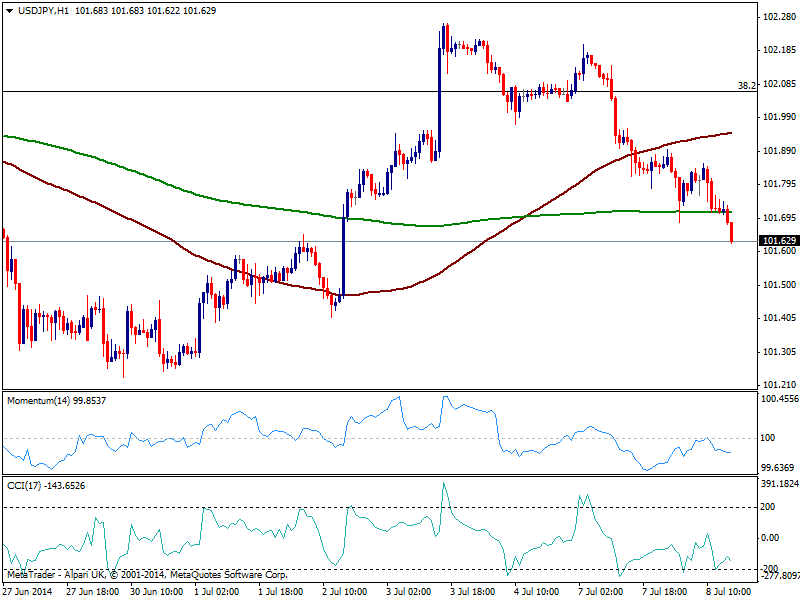
Yen maintains its strength against most rivals, with the USD/JPY trading at fresh 4-day lows, challenging 101.60 support. The hourly chart shows price extending below 200 SMA, with momentum heading south in negative territory, supporting a downward continuation. In the 4 hours chart indicators look a bit exhausted to the upside, but far from oversold readings. Current level has prove strong in the past so a break should not be that easy on a first attempt, yet if pressure remains and US stocks extend their decline, the slide can quickly extend down to 101.20 price zone.
Support levels: 101.60 101.20 100.70
Resistance levels: 101.95 102.35 102.80
AUD/USD Current price: 0.9407
View Live Chart for the AUD/USD
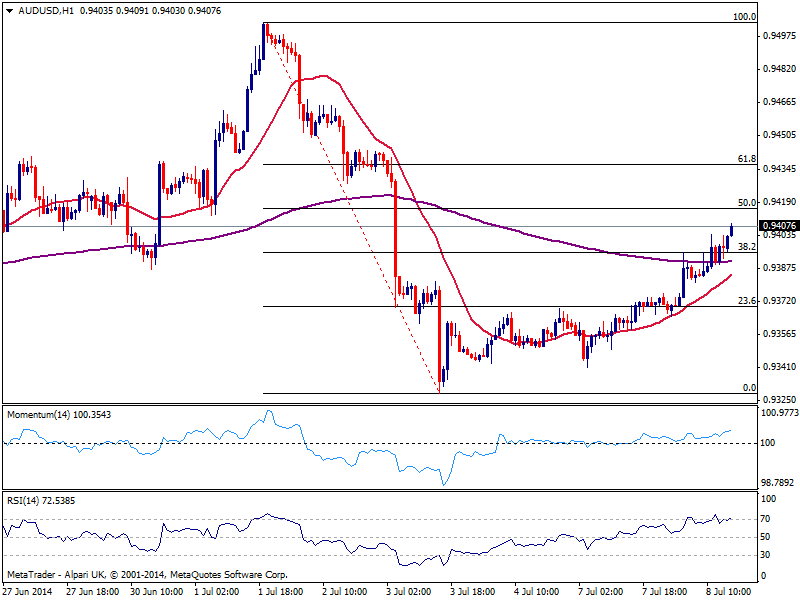
The AUD/USD trades back above the 0.9400 mark having regained the level on the back of positive local data. The hourly chart shows price extended above the 38.2% retracement of its latest bearish run, now acting as immediate short term support around 0.9390. Indicators in the same time frame head north above their midlines, while 20 SMA presents a clear bullish slope below current price, all of which maintains the risk to the upside. In the 4 hours chart the outlook is also bullish, with 0.9420 as immediate resistance as per being the 50% retracement of the same Fibonacci rally.
Support levels: 0.9400 0.9370 0.9330
Resistance levels: 0.9420 0.9460 0.9500
Recommended Content
Editors’ Picks

USD/JPY pops and drops on BoJ's expected hold
USD/JPY reverses a knee-jerk spike to 142.80 and returns to the red below 142.50 after the Bank of Japan announced on Friday that it maintained the short-term rate target in the range of 0.15%-0.25%, as widely expected. Governor Ueda's press conference is next in focus.

AUD/USD bears attack 0.6800 amid PBOC's status-quo, cautious mood
AUD/USD attacks 0.6800 in Friday's Asian trading, extending its gradual retreat after the PBOC unexpectedly left mortgage lending rates unchanged in September. A cautious market mood also adds to the weight on the Aussie. Fedspeak eyed.

Gold consolidates near record high, bullish potential seems intact
Gold price regained positive traction on Thursday and rallied back closer to the all-time peak touched the previous day in reaction to the Federal Reserve's decision to start the policy easing cycle with an oversized rate cut.

Ethereum rallies over 6% following decision to split Pectra upgrade into two phases
In its Consensus Layer Call on Thursday, Ethereum developers decided to split the upcoming Pectra upgrade into two batches. The decision follows concerns about potential risks in shipping the previously approved series of Ethereum improvement proposals.

Bank of Japan set to keep rates on hold after July’s hike shocked markets
The Bank of Japan is expected to keep its short-term interest rate target between 0.15% and 0.25% on Friday, following the conclusion of its two-day monetary policy review. The decision is set to be announced during the early Asian session.

Moneta Markets review 2024: All you need to know
VERIFIED In this review, the FXStreet team provides an independent and thorough analysis based on direct testing and real experiences with Moneta Markets – an excellent broker for novice to intermediate forex traders who want to broaden their knowledge base.