Pivot Points


Elliott Wave chartSPECIAL

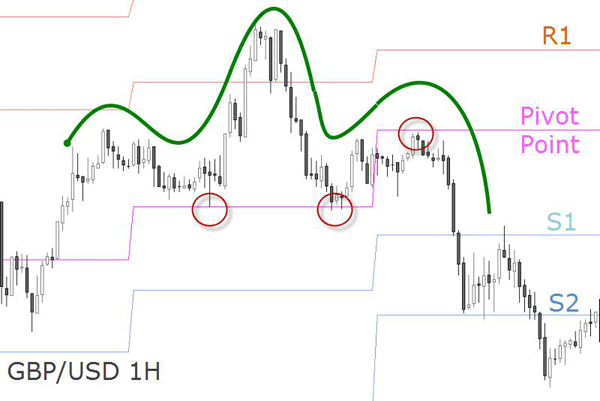
Identify support and resistance

Pivot Points, one of the basic and most important technical tools and the important one, is in the was used long before the era of computerized trading.

1. The London session is still the most liquid of all sessions traded, specially during its start and during the overlap period with the start of the New York session. You want to calculate your pivots points using the GMT session high, low and close. Why? Much like any Support or Resistance level created during a high liquid session, the highs and lows of the day are more significant during these hours.

2. Just like all traditional S&R price levels, the pivot levels can reverse roles also. An old resistance can turn into a new support once it is violated, and vice versa.

3. You can also use indicators (Bollinger Bands, Stochastics, RSI, Commodity Channel Index etc.) to time your entries around these levels. A very useful print is the 161,8% extension of the Fibonacci tool: when this level matches with one of the S&R pivot levels, price is likely to be attracted by this confluence. This is specially helpful for breakout trades making them much more effective. Pivot points act as veritable price magnets for the next day's trading.

4. Pivot points can also be used on weekly and monthly charts to get a perspective of where price is trading in reference to the previous week's or month's price range.

5. Any long term pivot point (weekly and monthly) which has not been touched by price for a large period of time gains attractiveness as a target level for counter trend moves. So if you don't feel comfortable with all the trend following techniques mentioned, this one is for you.

6. On high volatile market conditions, a break of the first support or resistance pivot level will mostly lead to a move to the next level (S2 and R2 respectively). This phenomenon is observed in pairs with higher volatility as well.

Trading Spot Forex with Pivot Points

The Pivot Point is a level in which the sentiment of the market changes from bullish to bearish or vice versa. If the market breaks this level to the upside, then the sentiment is said to be positive for that day and it is likely to continue its way up.

On the other hand, if the price slips under this level, then the sentiment is considered negative, and it is expected to continue its depretiation. 


Pivot Points are also expected to provide some kind of support or resistance, and if price can't break any of the associated R or S levels, a possible bounce from it is plausible. Since the Forex is a 24hr market there is an eternal debate on deciding at which time the open, the close, the high and the low from each 24-hour cycle should be taken. Nevertheless, the majority of traders agree that the most accurate predictions are achieved when the pivot point is adjusted to the GMT or the Eastern (New York - EST) times.


Daily Pivot Points with Streaming Rates

Sponsor broker


Pivot Points on Indices and Commodities


Preferred brokers in your location

Educational Material about Pivot Points

Pivot Points and Swing Trading

FXStreet DVD Series - Pivot Points and Swing Trading

The first DVD is designed to introduce you to pivot points and how price action relates to them from a statistical basis.

In the second DVD, we focus specifically on swing trading, particularly catching intraday momentum/trending moves.


Predicting Market Turns

Multiple Missed Pivots is Rob Booker's favorite method for predicting a market turn. Combined with price-oscillator divergences and specific candlestick formations it can let your friends wonder how did you see this turn in the market coming.

Pivot Points Re-Engineered Recap

Navin looks at Pivot Points in a very specific and unconventional manner: by focusing on the previous 3 days Pivots, and thereby on the recent three days S and R levels. The memory contained in the price-Pivot interaction explains a lot of the false breakouts, the sudden reversals in between Pivot Levels, and over shootings so common in leveraged markets. The presenter combines this observations with candlestick formations considering not only body shapes but also their wicks and tails. This recorded live session is not a stand alone strategy, but it definitely enhances the traders' ability to identify where buyers and sellers are sitting, and be able to trade in sideways moving markets as well as trending ones.

Pivot Points [Video]

Not only is a Pivot point associated with a support and resistance level, it is also a predictive indicator of price movement. Carol Harmer explains variations of the formula such as including the Open price or emphasizing the Close price. She also reiterates the importance of the R1 and S1 levels and the band between them as the most significant price area. Breakout strategies and sentimet gauges are possible applications of Pivot Points in trading financial markets and ultimately to make money. Trading during Asian, European and American sessions and confluences between moving averages and trendlines, all this in a jam-packed session with a true PP specialist.

Trading stocks with Camarilla pivots

Are you keen to trade mean reversion strategies? Camarilla Pivot Points are here proposed by author Bramesh Bhandari as a way to find the upper and lower trading ranges for a market on any particular day. These key levels either repel price or, after trading through it, accelerate price action in a predictable direction.

Pivotal

Pivot Points have gained enough popularity that they are almost a self-fulfilling prophecy on many markets, explains Brandon Wendell. They can be a valuable tool in your trading arsenal when combined with other support and resistance tools.

Trend Trading Perspective

Walter England simplifies the identification of support and resistance step of your trading methodology through the use of pivot points. Focused in scalping the Forex markets, he explain how to find pullbacks on price floors made of Camerilla Pivots and so enter the trade on the side of momentum. Also non-directional strategies are possible by taking the bounces from range borders made of Camarilla Pivot Points. This scalping technique enable to establish positive risk-reward ratios on trades so the trader's performance is not dependent on achieving a high winning rate. The second part of the session focuses on a breakout trading strategy fined-tuned with oscillator-based oversold and overbought levels.

Using Pivot Points For Entry & Price Projections [Video]

Tyler Yell lays out the basic tenets of Pivot trading so you learn how to capture the meat of a price move.Using PPs, you are trading in step with prior price extremes, that means volatility. In this sense, very concerned about the risk, the author shows us how to find dip buying opportunities with low risk stop, using real time several set-ups on forex crosses.

Introduction to Pivot Points

This article contains the mathematical calculation of various types of Pivot Points: the classical or standard PP calculation, Fibonacci based Pivots, Woodie, Murrey and Camarrilla, more advanced PP indicator which helps traders in their Scalping and Day trading strategies.