EUR/USD Current price: 1.1245
View Live Chart for the EUR/USD

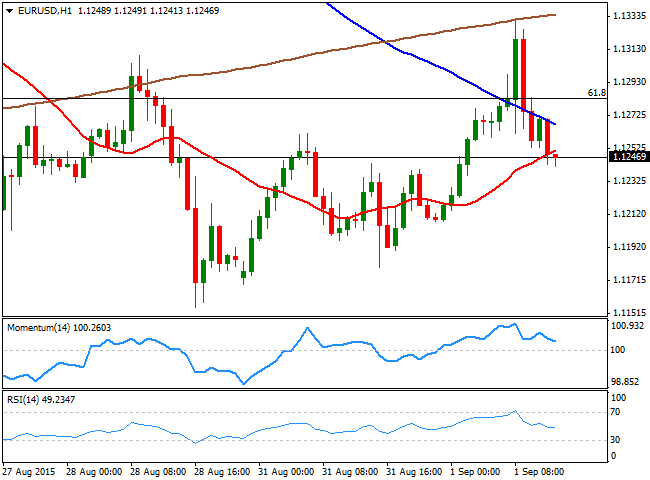
The EUR/USD pair advanced up to 1.1331 with the European opening, driven by market's sentiment, as Chinese woes continue. China manufacturing PMI's came below expected, whilst the service sector also grew less than expected in August, sending Asian share markets into the red. The negative mood extended into European equities that opened sharply lower, whilst safe-haven gold and yen soared. In Europe, the Markit Manufacturing PMI for August showed the economy generally contracted, with the EU reading down to 52.3, while France and Greece remain in contraction territory. The EU unemployment rate ticked lower, resulting at 10.9% in July.
The ECB is scheduled to have its monthly economic meeting next Thursday, with the general consensus pointing for a dovish stance, amid ongoing low inflation levels and worldwide economic slowdown, while the US will release its NFP monthly figures next Friday, which may determinate whether the FED will be able to raise rates this September, all of which keeps high levels of uncertainty and investors on their toes.
The EUR/USD gave back most of its initial gains, and trades a handful of pips above the 1.1200 figure ahead of the US opening, with the short term picture showing an increasing bearish potential as the price is back below its moving averages, while the technical indicators are aiming to cross their mid-lines towards the downside. In the 4 hours chart, the price is hovering around a flat 20 SMA, whilst the technical indicators have lost their upward strength and now turned lower below their mid-lines, supporting additional declines towards the 1.1160 price zone.
Support levels: 1.1200 1.1160 1.1120
Resistance levels: 1.1245 1.1280 1.1330
GBP/USD Current price: 1.5325
View Live Chart for the GPB/USD
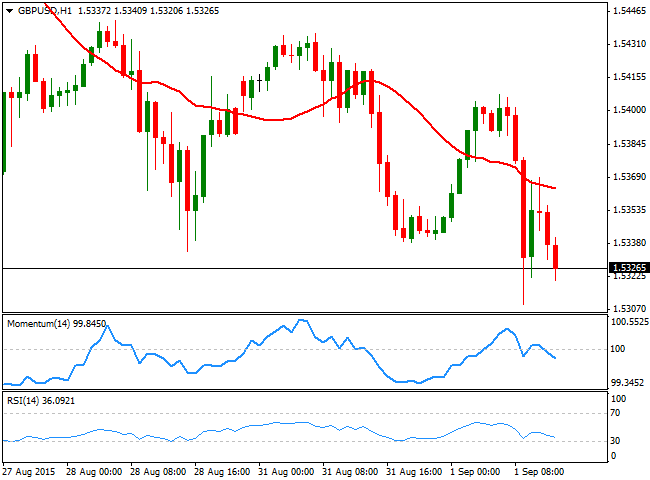
The GBP/USD pair fell down to 1.5309, a fresh 3-month low, on weak UK manufacturing readings that suggest Britain's economic recovery pace is beginning to slow down. The UK Markit Manufacturing PMI printed 51.5 against previous 51.9. The PMI's jobs index fell below 50 for the first time in over two years, suggesting that the labor market has begin slowing. The GBP/USD pair managed to post a limited bounce afterwards, contained however by selling interest in the 1.5360 price zone, now the immediate resistance. Technically, the 1 hour chart shows that the price is developing below its 20 SMA, whilst the technical indicators head lower below their mid-lines, maintaining the risk towards the downside. In the 4 hours chart the pair remains below a strongly bearish 20 SMA that contained the upside earlier in the day and now stands around 1.5390, whilst the technical indicators maintain negative slopes below their mid-lines, supporting a downward continuation towards 1.5250, a strong static support level.
Support levels: 1.5300 1.5250 1.5220
Resistance levels: 1.5360 1.5400 1.5440
USD/JPY Current price: 119.97
View Live Chart for the USD/JPY
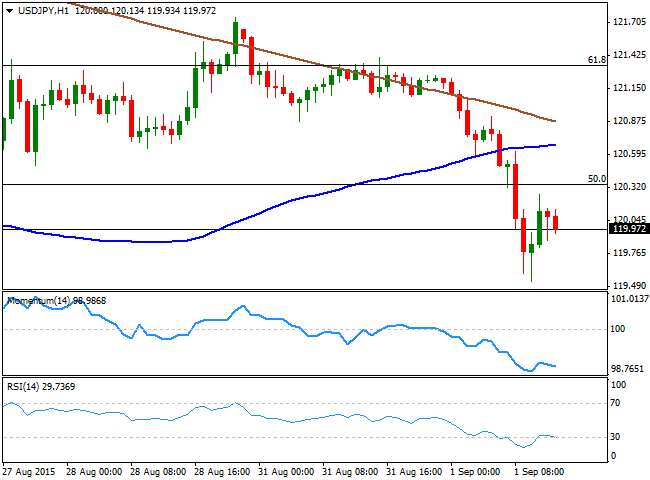
Fresh lows below 119.35 now eyed. The USD/JPY pair fell down to 119.54, over 150 pips below its daily opening as risk aversion spurred yen demand. The pair bounced from the level on dollar's mild recovery, but is having a hard time to regain the 120.00 level, maintaining an overall negative tone while trading within key Fibonacci levels. The 1 hour chart shows that the price accelerated lower after breaking below its 100 and 200 SMAs, whilst the RSI indicator is heading back south around 30 after correcting the extreme oversold readings reached with the European opening. In the 4 hours chart the price has fallen further below a bearish 100 SMA, whilst the technical indicator maintain their strong bearish slopes well into negative territory, supporting additional declines on a break below 119.35, the 38.2% retracement of the last two weeks decline, and the immediate support. The upside is now being limited by the 50% retracement of the same rally at 120.35, where the pair has stalled its recovery several times by the end of last week.
Support levels: 119.70 119.35 118.80
Resistance levels: 120.35 120.60 121.00
AUD/USD Current price: 0.7056
View Live Chart for the AUD/USD
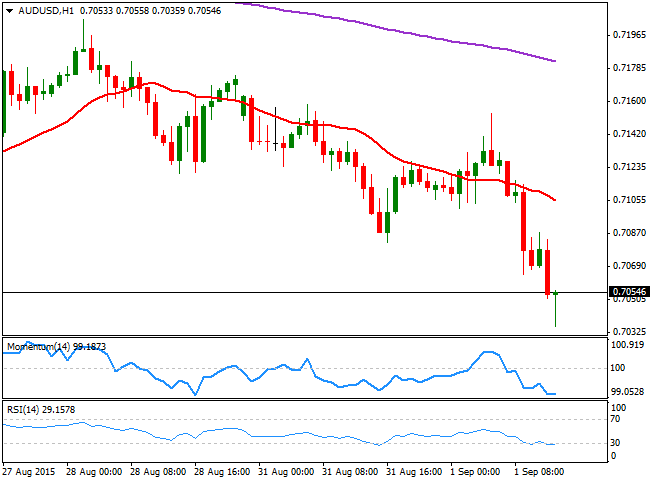
The AUD/USD pair is retesting its recent multi-year lows ahead of the US opening, with the pair bouncing some from 0.7035, but maintaining a strong negative tone. During the past Asian session, the RBA had its monthly economic meeting, leaving rates steady at 2.0%. The statement was slightly less dovish than expected, as the Central Bank acknowledged "some further softening in conditions in China and east Asia of late", but also saw stronger US growth. Nevertheless, the positive tone was not enough to boost the Aussie, that saw a short lived spike up to 0.7153 before resuming its decline. The overall stance is still bearish, as the 1 hour chart shows that the price remains well below a strongly bearish 20 SMA, although the technical indicators seem to be losing steam near oversold levels. In the 4 hours chart the bearish momentum remains strong, supporting a break below the 0.7000 level should the mentioned daily low give up.
Support levels: 0.7035 0.6985 0.6950
Resistance levels: 0.7070 0.7100 0.7140
Recommended Content
Editors’ Picks

AUD/USD approaches 0.6900 ahead of Australian inflation
The Aussie is among the best performers against the Greenback this week, trading at fresh 2024 highs, not far from the 0.6900 mark. Australian inflation data taking centre stage in the Asian session.

EUR/USD extend recovery amid persistent USD weakness
The Euro benefited from the broad US Dollar’s weakness on Tuesday, trimming weekly losses and looking to retest the 1.1200 level. Additional gains out of the table amid discouraging European data.

Gold's unstoppable run extends beyond $2,650
Gold price keeps posting record highs on a daily basis, now comfortable above $2,650. Poor United States data fueled speculation the Federal Reserve will trim rates by another 50 bps when it meets in November.

Crypto Today: Bitcoin, Ethereum and XRP consolidate as SUI continues impressive run
Bitcoin traded around $63,600 on Tuesday, as prices appear to be consolidating within the $62,000 and $64,700 key levels. On-chain data shows that the consolidation may be due to profit-taking by holders and mild Bitcoin ETF net inflows of $4.5 million, per Farside Investors data.

RBA widely expected to keep key interest rate unchanged amid persisting price pressures
The Reserve Bank of Australia is likely to continue bucking the trend adopted by major central banks of the dovish policy pivot, opting to maintain the policy for the seventh consecutive meeting on Tuesday.

Moneta Markets review 2024: All you need to know
VERIFIED In this review, the FXStreet team provides an independent and thorough analysis based on direct testing and real experiences with Moneta Markets – an excellent broker for novice to intermediate forex traders who want to broaden their knowledge base.