EUR/USD Current price: 1.0729
View Live Chart for the EUR/USD
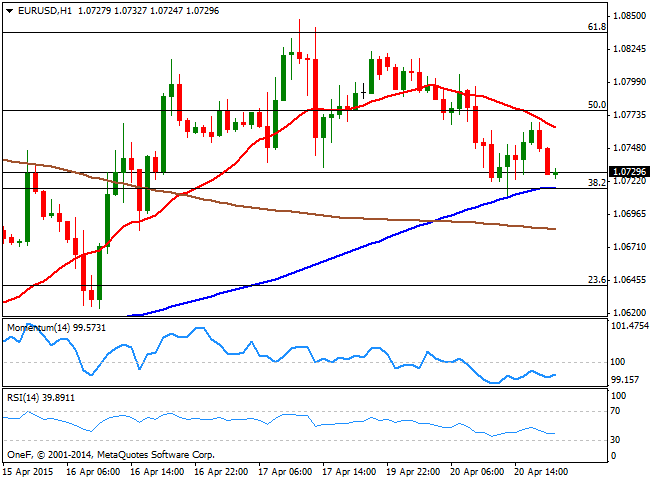
The EUR/USD pair fell down to 1.0711 this Monday, as the American dollar got boosted by bad news among others major economies. Early in Europe, data coming from the region resulted disappointing, as German PPI fell into negative territory yearly basis in March, down 1.7% compared to a year before. The Euro zone construction output also fell beyond expected, down 1.8% in February, and 3.7% compared to a year earlier. There was no fundamental data in the US, but ECB's Vice President Constancio said in the American afternoon that Greece might not have to leave the euro area even if it defaults on its debt, unless the decision comes from the Greek government itself. Indeed, the Greek woes are the major weigh on the EUR these days, as the rest of the common area members are still demanding a clear list of reforms before releasing more bailout.
Technically, the EUR/USD 1 hour chart shows that the price hovers near the daily low, with the price developing below a bearish 20 SMA and the technical indicators showing no directional strength below their mid-lines. In the same chart, the 100 SMA stands along with the 38.2% retracement of the latest bearish run between 1.1034 and 1.0519 around the mentioned daily low of 1.0710, suggesting that if the level gives up, the risk towards the downside will increase. In the 4 hours chart the price stands below a bullish 20 SMA, whilst the technical indicators maintain a bearish slope above their mid-lines, supporting the shorter term view of further declines needed to confirm a bearish continuation.
Support levels: 1.0710 1.0680 1.0650
Resistance levels: 1.0745 1.0775 1.0820
EUR/JPY Current price: 128.00
View Live Chart for the EUR/JPY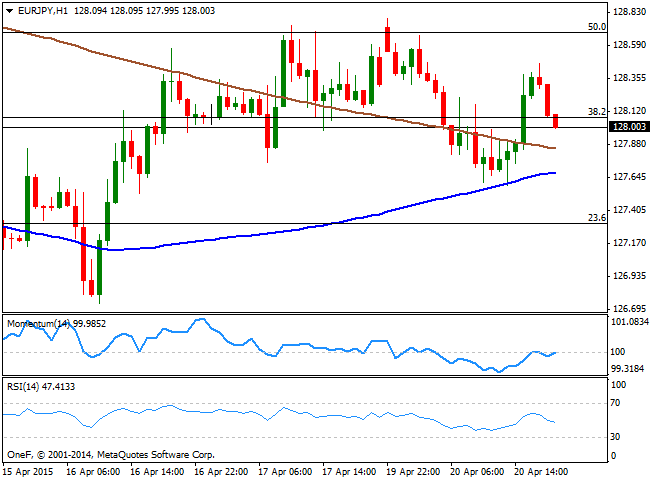
The EUR/JPY cross edged lower amid EUR weakness, having set a daily low at 127.58 during the past Asian session. The Japanese yen lost ground as European and American equities posted strong intraday gains, albeit the pair is struggling to hold above the 128.00 level. Technically, the 1 hour chart shows that the Momentum indicator stands flat around the 100 level, while the RSI indicator heads lower around 47. In the same chart, the 200 SMA heads lower around 127.80 whilst the 100 SMA stands at 127.70 offering immediate intraday support as the pair already bounced from this last earlier in the day. In the 4 hours chart the price remained below its moving averages that maintain strong bearish slopes, whilst the technical indicators head lower towards their mid-lines, suggesting some additional declines on a break below the mentioned 127.70 level.
Support levels: 127.70 127.30 126.90
Resistance levels: 128.40 128.80 129.20
GBP/USD Current price: 1.4891
View Live Chart for the GBP/USD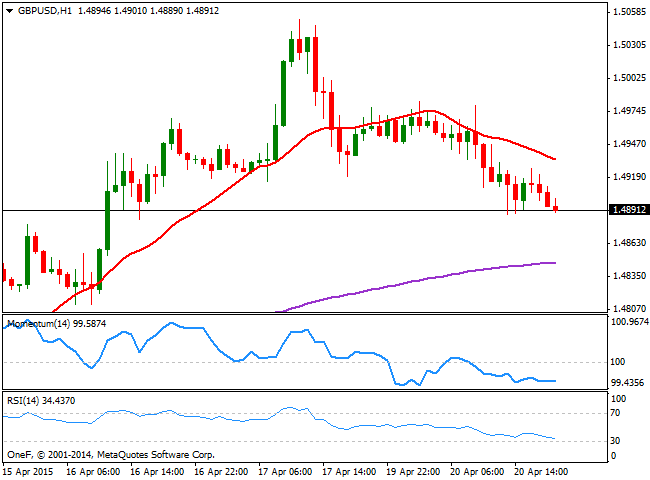
The British Pound extended its decline sub 1.4900 against its American rival, after failing to sustain gains beyond the 1.5000 figure last Friday. The pair reached a daily low of 1.4887 on the back of dollar's recovery early during the US session, boosted by tepid European data and growing fears of a Grexit. The UK calendar will remain quiet also on Tuesday, with investors therefore focused in the upcoming May elections when trading the pair. On Wednesday, the BOE will release the Minutes of its latest meeting, but it won't be until Thursday, with the release of Retail Sales and Public Sector Borrowing data that there will macro news to guide the Pound. In the meantime, the pair maintains a short term bearish tone, as the 1 hour chart shows that the price develops below a bearish 20 SMA, whilst the technical indicators head lower below their mid-lines. In the 4 hours chart the price broke below its 20 SMA and the 200 EMA, both converging in the 1.4910 region acting now as the immediate intraday resistance, while the technical indicators head lower around their mid-lines, supporting the shorter term view.
Support levels: 1.4870 1.4830 1.4790
Resistance levels: 1.4910 1.4950 1.5000
USD/JPY Current price: 119.31
View Live Chart for the USD/JPY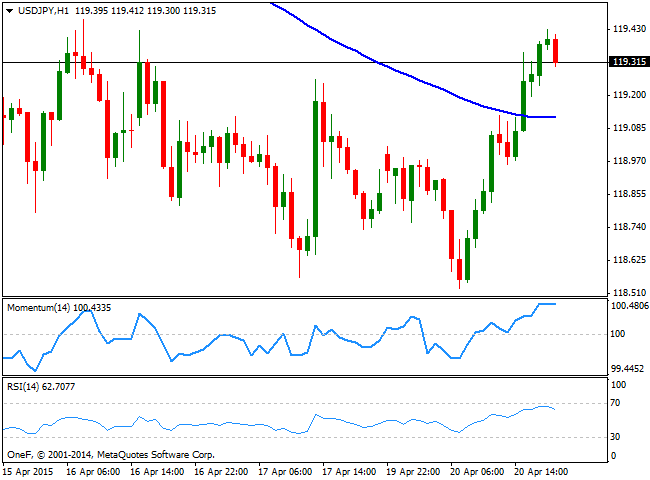
The USD/JPY surged to a daily high of 119.43 during the US session, having posted a fresh 1-month earlier in the day at 118.52. The pair found support in rising US yields as 10Y one surged sharply to 1.90% by the end of the day. Japan will release some confidence data during the upcoming Asian session, albeit the pair will rather continue to trade accordingly to market sentiment than to local data. Short term, the 1 hour chart shows that the pair advanced above its 100 SMA, currently around 119.10, whilst the Momentum indicator heads strongly higher in overbought territory. In the same chart however, the RSI retreats from overbought territory, now heading lower around 60. In the 4 hours chart, the price remains well below its moving averages, whilst the technical indicators present a mild positive tone above their mid-lines. Nevertheless some steady gains beyond the 119.40 region are required to confirm further advances, with a break below 118.90, on the other hand, probably signaling a retest of the mentioned daily low.
Support levels: 118.90 118.50 118.15
Resistance levels: 119.40 119.80 120.10
AUD/USD Current price: 0.7715
View Live Chart for the AUD/USD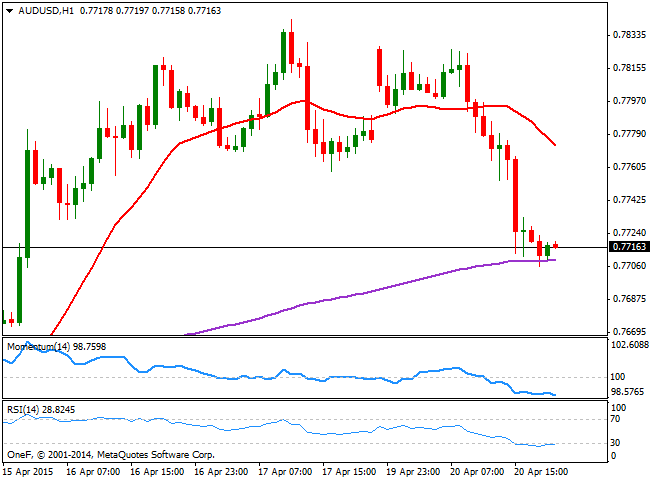
The Aussie got hit by RBA Governor Glenn Stevens during the American afternoon, as the head of the Central Bank said that rates could be cut again. Speaking at the American Australian Association luncheon hosted by Goldman Sachs, in New York Stevens said rates can be cut again if needed, but is concerned about the impact it may have on house prices, as, despite home building is rising as intended, prices are up at a time when Australians are already highly leveraged. Investors focused on the headline, driving the AUD/USD pair sharply lower to a fresh 3-day low of 0.7706. The short term technical picture maintains a bearish stance, as in the 1 hour chart, the price stands well below its 20 SMA whilst the technical indicators continue to head lower, despite in oversold territory. In the 4 hours chart the price struggles around its 200 EMA, usually a strong dynamic support/resistance level, while the Momentum indicator heads sharply lower below the 100 level and the RSI stands directionless around 46. The downside is favored albeit some follow through below the 0.7685 static support is required to confirm such bearish extension over the upcoming sessions.
Support levels: 0.7685 0.7640 0.7600
Resistance levels: 0.7730 0.7780 0.7810
Recommended Content
Editors’ Picks
EUR/USD trades with negative bias, holds above 1.0700 as traders await US PCE Price Index

EUR/USD edges lower during the Asian session on Friday and moves away from a two-week high, around the 1.0740 area touched the previous day. Spot prices trade around the 1.0725-1.0720 region and remain at the mercy of the US Dollar price dynamics ahead of the crucial US data.
USD/JPY jumps above 156.00 on BoJ's steady policy

USD/JPY has come under intense buying pressure, surging past 156.00 after the Bank of Japan kept the key rate unchanged but tweaked its policy statement. The BoJ maintained its fiscal year 2024 and 2025 core inflation forecasts, disappointing the Japanese Yen buyers.
Gold price flatlines as traders look to US PCE Price Index for some meaningful impetus

Gold price lacks any firm intraday direction and is influenced by a combination of diverging forces. The weaker US GDP print and a rise in US inflation benefit the metal amid subdued USD demand. Hawkish Fed expectations cap the upside as traders await the release of the US PCE Price Index.
Sei Price Prediction: SEI is in the zone of interest after a 10% leap

Sei price has been in recovery mode for almost ten days now, following a fall of almost 65% beginning in mid-March. While the SEI bulls continue to show strength, the uptrend could prove premature as massive bearish sentiment hovers above the altcoin’s price.
US economy: Slower growth with stronger inflation

The US Dollar strengthened, and stocks fell after statistical data from the US. The focus was on the preliminary estimate of GDP for the first quarter. Annualised quarterly growth came in at just 1.6%, down from the 2.5% and 3.4% previously forecast.