EUR/USD Current price: 1.1262
View Live Chart for the EUR/USD
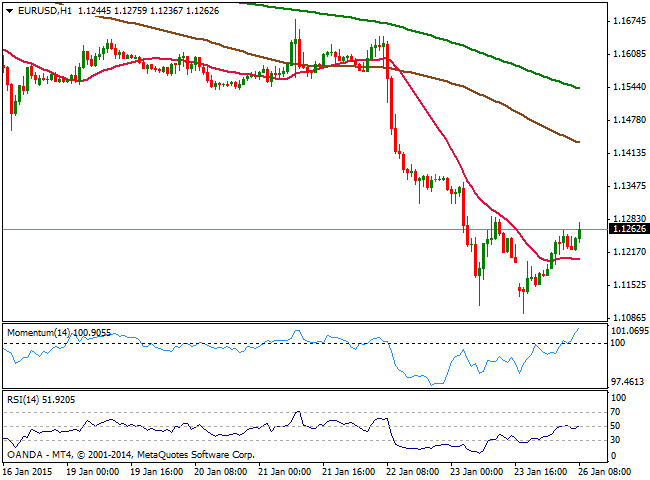
Following a recovery from a fresh 11-year low at 1.1097 posted early Asian session, the EUR/USD pair advances to fresh daily highs in the 1.1270 price zone. The lack of relevant data, stocks momentum, and market speculation the SNB continues to intervene the currency markets to keep franc down despite lifting the cap, is giving the common currency a breather this Monday. The pair continues to trade in wide intraday ranges, having so far moved around 180 pips. Technically, the short term picture favors the upside, with the 1 hour chart showing indicators aiming higher above their midlines, and price approaching 1.1285 area, the immediate static resistance. In the 4 hours chart indicators lost upward strength after recovering from extreme oversold levels, whilst 20 SMA maintains a strong bearish slope limiting the upside around 1.1325 in case of further advances.
Support levels: 1.1245 1.1200 1.1150
Resistance levels: 1.1290 1.1325 1.1360
GBP/USD Current price: 1.5023
View Live Chart for the GBP/USD
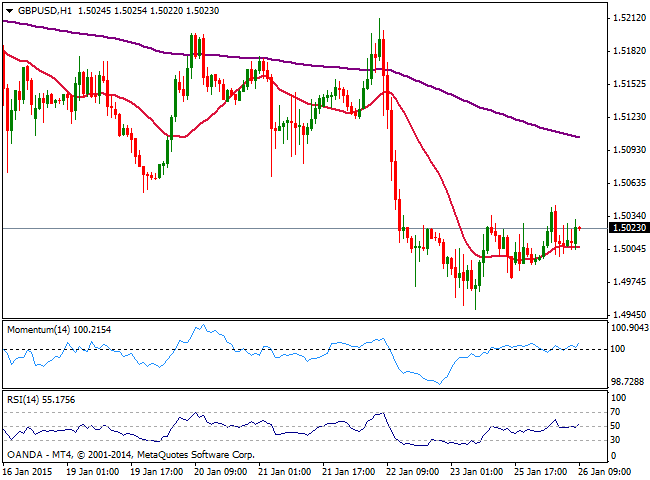
The GBP/USD pair consolidates above the 1.5000 figure, having set a daily high of 1.5043 earlier on the day. With no local data to drive the currencies, the pair trades in a quite tight range, lacking intraday strength according to the 1 hour chart, as per indicator aiming barely higher around their midlines. In the same time frame, the price stands above a flat 20 SMA, offering dynamic support around the 1.5000 figure. In the 4 hours chart however, the technical picture is clearly bearish, with the price holding below a bearish 20 SMA and indicators heading lower below their midlines.
Support levels: 1.5000 1.4950 1.4910
Resistance levels: 1.5035 1.5080 1.5125
USD/JPY Current price: 118.34
View Live Chart for the USD/JPY
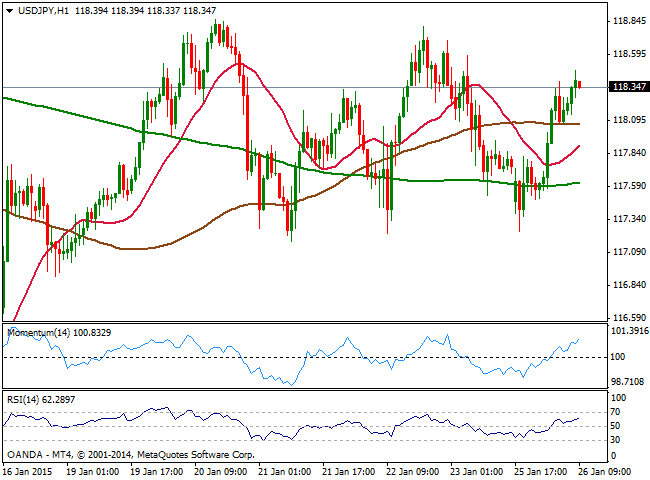
The USD/JPY found again buyers around the 117.30 level, and trades near its daily high of 118.47, confined to its last week range. Short term, the technical picture favors the upside, as per indicators heading strongly up above their midlines, and the price developing above moving averages, with the 100 SMA offering intraday support at 118.10. In the 4 hours chart however, the technical picture remains neutral, with indicators hovering around their midlines. The pair needs to extend either above 118.80 or break below 117.00 to gain some directional strength.
Support levels: 118.00 117.60 117.30
Resistance levels: 118.80 119.20 119.55
AUD/USD Current price: 0.7918
View Live Chart of the AUD/USD
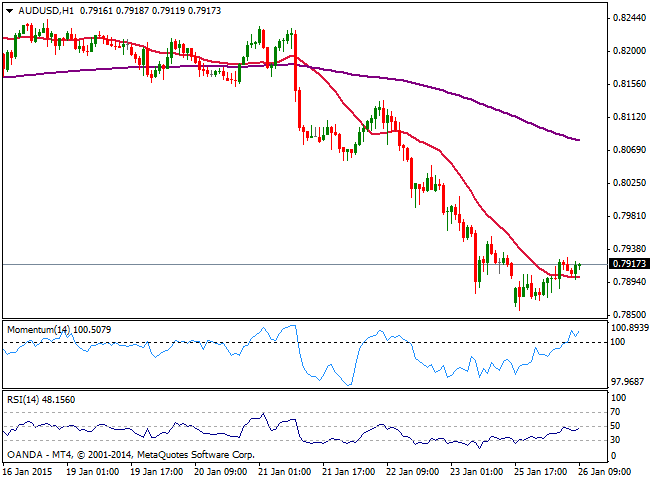
Australian dollar recovered ground against the greenback, but the pair remains subdued, trading right above the 0.7900 mark. The 1 hour chart shows that indicators aim higher above their midlines, while 20 SMA stands flat around the figure, offering short term support. In the 4 hours chart the corrective movement has lost momentum according to indicators that turn now lower, while 20 SMA maintains a strong bearish slope well above current levels, still favoring the downside, regardless of intraday upward corrections.
Support levels: 0.7900 0.7860 0.7830
Resistance levels: 0.7925 0.7960 0.8000
Recommended Content
Editors’ Picks
EUR/USD holds above 1.0700 ahead of key US data

EUR/USD trades in a tight range above 1.0700 in the early European session on Friday. The US Dollar struggles to gather strength ahead of key PCE Price Index data, the Fed's preferred gauge of inflation, and helps the pair hold its ground.
USD/JPY stays above 156.00 after BoJ Governor Ueda's comments

USD/JPY holds above 156.00 after surging above this level with the initial reaction to the Bank of Japan's decision to leave the policy settings unchanged. BoJ Governor said weak Yen was not impacting prices but added that they will watch FX developments closely.
Gold price oscillates in a range as the focus remains glued to the US PCE Price Index

Gold price struggles to attract any meaningful buyers amid the emergence of fresh USD buying. Bets that the Fed will keep rates higher for longer amid sticky inflation help revive the USD demand.
Sei Price Prediction: SEI is in the zone of interest after a 10% leap

Sei price has been in recovery mode for almost ten days now, following a fall of almost 65% beginning in mid-March. While the SEI bulls continue to show strength, the uptrend could prove premature as massive bearish sentiment hovers above the altcoin’s price.
US core PCE inflation set to signal firm price pressures as markets delay Federal Reserve rate cut bets

The core PCE Price Index, which excludes volatile food and energy prices, is seen as the more influential measure of inflation in terms of Fed positioning. The index is forecast to rise 0.3% on a monthly basis in March, matching February’s increase.