EUR/USD Current price: 1.1013
View Live Chart for the EUR/USD
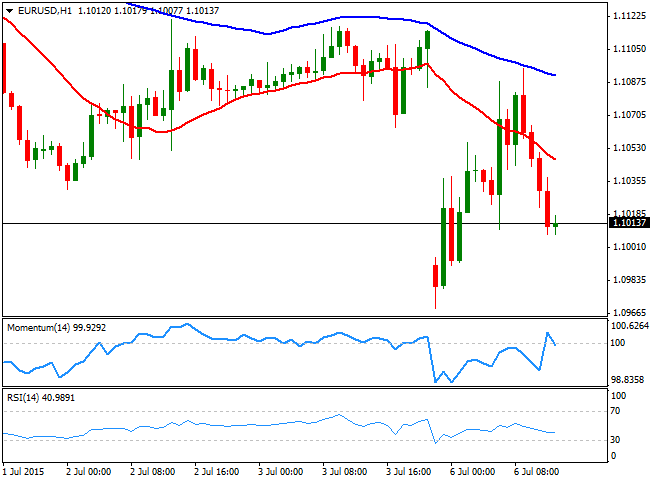
The forex market is once again depending on risk sentiment, as the Greek referendum resulted in a victory of those who are against more austerity. The Greek government welcomed the result as a win of its policy, assuming its creditors will come with a more humble stance to the negotiation table. The optimism of a new deal to save the country however, diluted in the European morning, as the FM Varoufakis resigned to its position on pressures from its counterparts, whilst Germany has made it clear that it is in no rush to resume negotiations. The country is in default, and running out of cash, despite the capital controls imposed last week. As for the EUR/USD pair, it surged up to 1.1095, but is now struggles around the 1.1000 level, maintaining a short term negative bias, as the 1 hour chart shows that the price was rejected from its 100 SMA and even extended below a bearish 20 SMA, whilst the technical indicators have turned south and stand now in negative territory. In the 4 hours chart, the price retreated after failing to overcome its 20 SMA, whist the technical indicators are slowly gaining bearish potential in negative territory, supporting the longer term view and a retest of the 1.0950/60 region.
Support levels: 1.0955 1.0910 1.0860
Resistance levels: 1.1050 1.1090 1.1120
GBP/USD Current price: 1.5552
View Live Chart for the GBP/USD
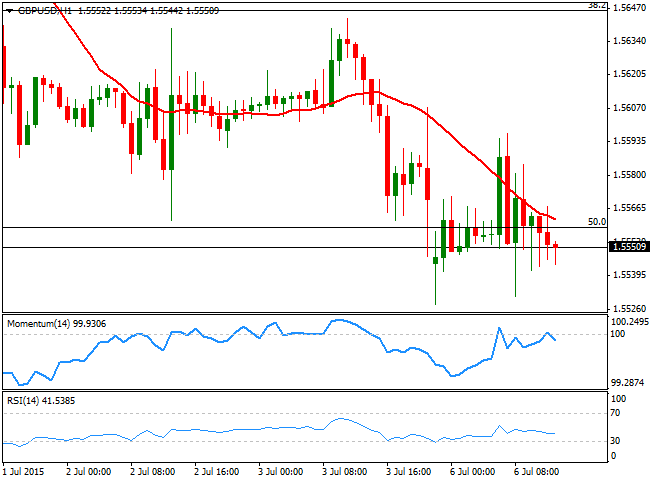
The GBP/USD pair trades lower in range, having set a fresh 3-week low of 1.5527 before bouncing up to the 1.5600 region early Europe. The British Pound has been holding pretty fairly to the ongoing risk aversion environment, as the UK economy continues to give signs of economic recovery. Nevertheless, the short term technical picture for the pair favors a downside breakout, as the 1 hour chart shows that the 20 SMA presents a bearish slope above the current price, whilst the Momentum indicator turned lower around its mid-line, and the price is unable to recover above the 50% retracement of its latest bullish run. In the 4 hours chart the technical picture also favors the downside, with the RSI flat around 3 and the price developing below its 20 SMA and the 200 EMA. At this point, only a recovery above 1.5610/20 will be able to revert the intraday negative tone, and favor a recovery up to the 1.5650/60 region.
Support levels: 1.5520 1.5170 1.5130
Resistance levels: 1.5570 1.5620 1.5660
USD/JPY Current price: 122.68
View Live Chart for the USD/JPY
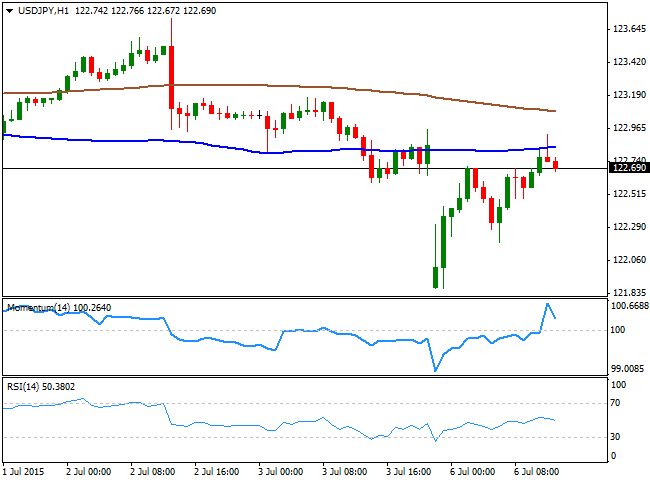
The USD/JPY sunk to a fresh 1-month low of 121.87 at the weekly opening, but managed to erase its intraday losses during the Asian session, amid BOJ´s Kuroda comments on the economic policy, remarking QE will be maintain as long as it's needed. He also noticed that the economic recovery is moderated, whilst inflation expectations remain subdued. The pair approached the 123.00 region and filled the weekly opening gap before turning back south, and the 1 hour chart shows that the price was unable to recover beyond its 100 SMA, whilst the technical indicators have turned sharply lower, still holding above their mid-lines. In the 4 hours chart, the price remains far below its 100 and 200 SMAs, while the technical indicators have turned south in negative territory, after a limited upward corrective movement, all of which supports a downward continuation, particularly on a break below 121.45, the immediate static support. The upside will remain limited as long as the price holds below the 123.30 region.
Support levels: 122.45 122.00 121.70
Resistance levels: 122.95 123.30 123.80
AUD/USD Current price: 0.7496
View Live Chart for the AUD/USD
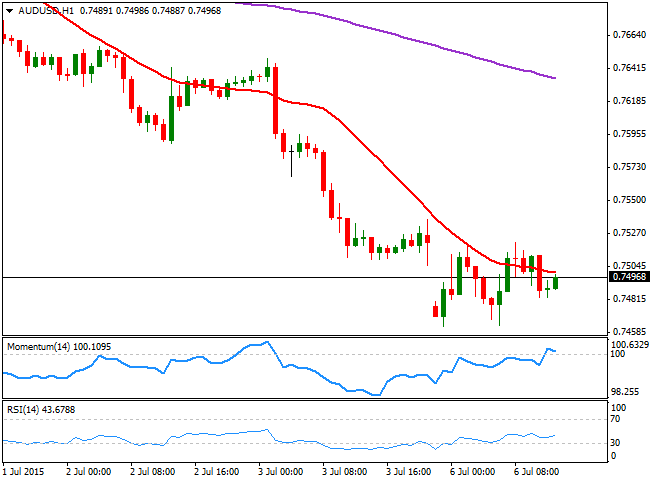
The Aussie is recovering some ground against the greenback after falling down to a fresh multi-year low of 0.7462 early Asia, with the AUD/USD pair still unable to establish above the 0.7500 level. The Australian dollar has been under selling pressure on mounting speculation the RBA may cut rates at least one more time this year. Short term, the 1 hour chart shows that the price stands a few pips below a bearish 20 SMA, whilst the technical indicators lack clear directional strength, as the Momentum turned lower above the 100 level, whilst the RSI indicator aims higher around 44. In the 4 hours chart, the 20 SMA heads sharply lower well above the current price, whilst the technical indicators have barely bounced from oversold readings, limiting chances of a stronger advance.
Support levels: 0.7460 0.7425 0.7380
Resistance levels: 0.7520 0.7555 0.7590
Recommended Content
Editors’ Picks

AUD/USD approaches 0.6900 ahead of Australian inflation
The Aussie is among the best performers against the Greenback this week, trading at fresh 2024 highs, not far from the 0.6900 mark. Australian inflation data taking centre stage in the Asian session.

EUR/USD extend recovery amid persistent USD weakness
The Euro benefited from the broad US Dollar’s weakness on Tuesday, trimming weekly losses and looking to retest the 1.1200 level. Additional gains out of the table amid discouraging European data.

Gold's unstoppable run extends beyond $2,650
Gold price keeps posting record highs on a daily basis, now comfortable above $2,650. Poor United States data fueled speculation the Federal Reserve will trim rates by another 50 bps when it meets in November.

Crypto Today: Bitcoin, Ethereum and XRP consolidate as SUI continues impressive run
Bitcoin traded around $63,600 on Tuesday, as prices appear to be consolidating within the $62,000 and $64,700 key levels. On-chain data shows that the consolidation may be due to profit-taking by holders and mild Bitcoin ETF net inflows of $4.5 million, per Farside Investors data.

RBA widely expected to keep key interest rate unchanged amid persisting price pressures
The Reserve Bank of Australia is likely to continue bucking the trend adopted by major central banks of the dovish policy pivot, opting to maintain the policy for the seventh consecutive meeting on Tuesday.

Moneta Markets review 2024: All you need to know
VERIFIED In this review, the FXStreet team provides an independent and thorough analysis based on direct testing and real experiences with Moneta Markets – an excellent broker for novice to intermediate forex traders who want to broaden their knowledge base.


