EUR/USD Current price: 1.0780
View Live Chart for the EUR/USD

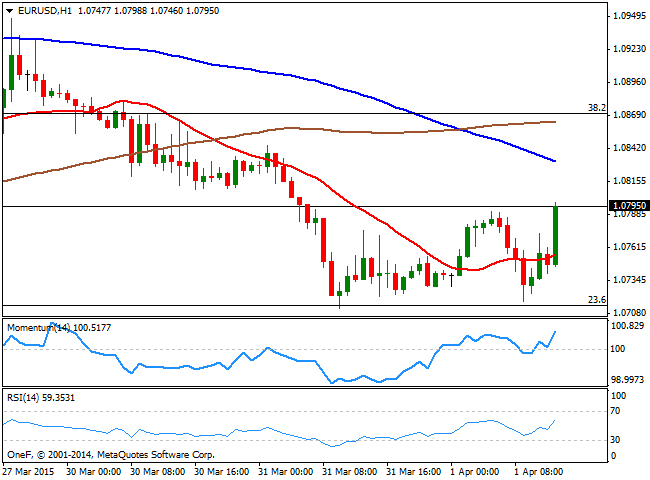
The EUR/USD pair bounced sharply once again from the 1.0710 region, following a disappointing USD employment ADP survey, pointing anticipating less jobs created during March: the survey printed 189K new jobs against 225K expected, whilst previous month figure was revised to 214K. Earlier in the day, European data pointed out that the region recovery is slowly gaining track, as European PMI readings beat expectations in March.
Dollar's early strength is being reversed early in the US session, and the 1 hour chart for the EUR/USD shows that the price accelerated above its 20 SMA, whilst the technical indicators head higher above their mid-lines, pointing to a short term upward continuation. In the 4 hours chart however, the price remains below a mild bearish 20 SMA, currently offering dynamic resistance around 1.0815, whilst the technical indicators aim slightly higher, but remain below their mid-lines. A steady advance above the mentioned 1.0815 level may see the price extending up to 1.0865, a strong Fibonacci resistance, although sellers will likely contain the price around it.
Support levels: 1.0760 1.0710 1.0660
Resistance levels: 1.0815 1.0865 1.0900
GBP/USD Current price: 1.4797
View Live Chart for the GBP/USD
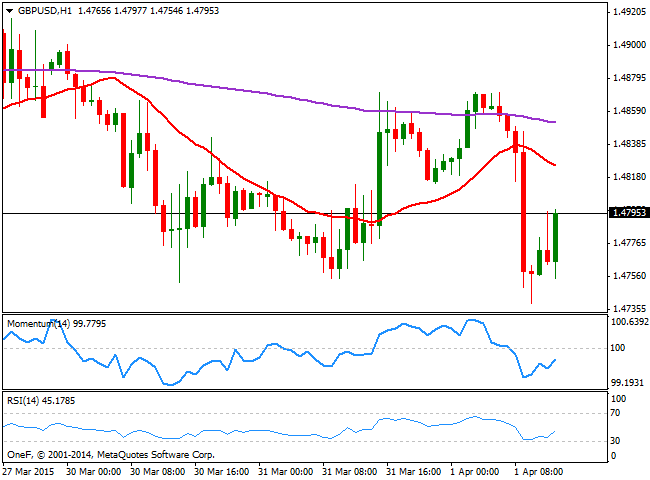
The GBP/USD pair recovers from a fresh weekly low established at 1.4739, aiming to advance once again above the 1.4800 figure. In the UK, Markit Manufacturing PMI showed the economy grew to an eight-month high in March, reaching 54.4, but failed to boost the Pound at the moment, as market is all about US rates these days. Technically, the 1 hour chart shows that the price erased half of its intraday losses, still well below its 20 SMA around 1.4830, whilst indicators recover from oversold levels but remain in negative territory. In the 4 hours chart the bearish tone prevails with the price developing below its 20 SMA and the technical indicators below their mid-lines. Renewed selling interest below the 1.4750 however, is required to confirm further intraday declines, particularly if the price remains capped below the mentioned 1.4830 price zone.
Support levels: 1.4750 1.4710 1.4660
Resistance levels: 1.4830 1.4990 1.4900
USD/JPY Current price: 119.81
View Live Chart for the USD/JPY
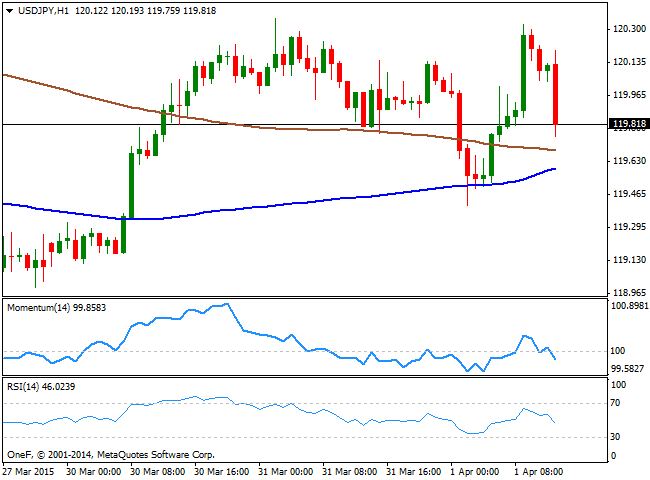
After flirting with the weekly highs around 120.35, the USD/JPY pair is back below the 120.00 figure, following the disappointing US employment data. The pair has been for the most consolidating around the 120.00 region, with opposed market interests surging every time the pair moves 40/50 pips away of it in either direction. Technically, the 1 hour chart favors further declines, as the technical indicators turned sharply lower and crossed their mid-lines towards the downside, although the 100 and 200 SMAs provide intraday support in the 119.60 region. In the 4 hours chart the price is moving back and forth around a flat 200 SMA, but remained below the 100 SMA, whilst the technical indicators turned lower in positive territory, albeit lacking clear trading signals.
Support levels: 119.50 119.20 118.80
Resistance levels: 120.10 120.45 120.80
AUD/USD Current price: 0.7616
View Live Chart for the AUD/USD
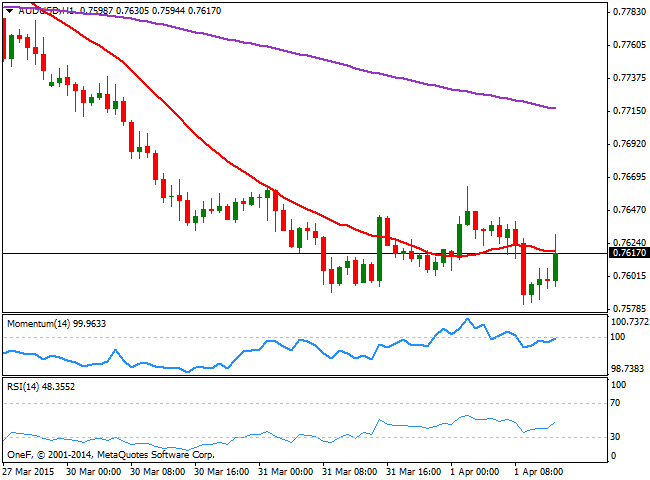
The AUD/USD pair recovers from a daily low set at 0.7582, albeit the movement is quite shallow, as selling interest around the pair remains high ahead of the next RBA meeting. The 1 hour chart shows that the price is struggling to advance above its 20 SMA, whilst the technical indicators present a tepid bullish slope below their mid-lines. In the 4 hours chart, indicators are barely bouncing from oversold levels, whilst the 20 SMA maintains a strong bearish slope, providing a strong resistance around 0.7660, the level to break to see the pair kick starting an upward corrective movement.
Support levels: 0.7590 0.7555 0.510
Resistance levels: 0.7625 0.7660 0.7700
Recommended Content
Editors’ Picks
EUR/USD holds above 1.0700 ahead of key US data

EUR/USD trades in a tight range above 1.0700 in the early European session on Friday. The US Dollar struggles to gather strength ahead of key PCE Price Index data, the Fed's preferred gauge of inflation, and helps the pair hold its ground.
USD/JPY stays above 156.00 after BoJ Governor Ueda's comments

USD/JPY holds above 156.00 after surging above this level with the initial reaction to the Bank of Japan's decision to leave the policy settings unchanged. BoJ Governor said weak Yen was not impacting prices but added that they will watch FX developments closely.
Gold price oscillates in a range as the focus remains glued to the US PCE Price Index

Gold price struggles to attract any meaningful buyers amid the emergence of fresh USD buying. Bets that the Fed will keep rates higher for longer amid sticky inflation help revive the USD demand.
Sei Price Prediction: SEI is in the zone of interest after a 10% leap

Sei price has been in recovery mode for almost ten days now, following a fall of almost 65% beginning in mid-March. While the SEI bulls continue to show strength, the uptrend could prove premature as massive bearish sentiment hovers above the altcoin’s price.
US core PCE inflation set to signal firm price pressures as markets delay Federal Reserve rate cut bets

The core PCE Price Index, which excludes volatile food and energy prices, is seen as the more influential measure of inflation in terms of Fed positioning. The index is forecast to rise 0.3% on a monthly basis in March, matching February’s increase.