EUR/USD Current price: 1.0968
View Live Chart for the EUR/USD
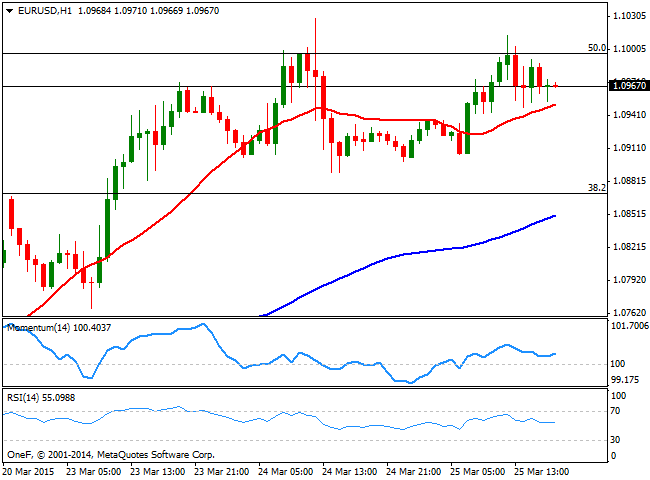
The FX Market ended another volatile day with the dollar mixed across the board. As for the Euro, the common currency managed to advance up to 1.1013, but once again, the pair was unable to sustain gains beyond the 1.1000 level, settling mid range by US close. The main fundamental release of the day came from the US, with Durable Goods Orders that unexpectedly plunged 1.4% in February, boosting the dollar's decline intraday. In Europe, Greek jitters continue to capture the headlines, as latest news say that the EU has gave Greece until Monday to deliver a plan of its reform commitments, according to some EU officials. Nevertheless, EUR buyers seem not concerned over the possibility of a Greek default at the time being, with the main focus still being whether the FED will raise rates in June or September.
Technically, the 1 hour chart presents a mild positive tone, with the price consolidating above its 20 SMA, and the technical indicators above their mid-lines, showing no directional strength. In the 4 hours chart the 20 SMA maintains a strong bullish slope, currently offering dynamic resistance around 1.0910, whilst the technical indicators have turned sharply lower, still above their mid-lines. The pair has found a comfort zone between 1.09/1.10 and will need a strong catalyst to break in one direction, something that may be delayed until Friday, with the US GDP figures.
Support levels: 1.0955 1.0910 1.0890
Resistance levels: 1.1000 1.1040 1.1085
EUR/JPY Current price: 131.15
View Live Chart for the EUR/JPY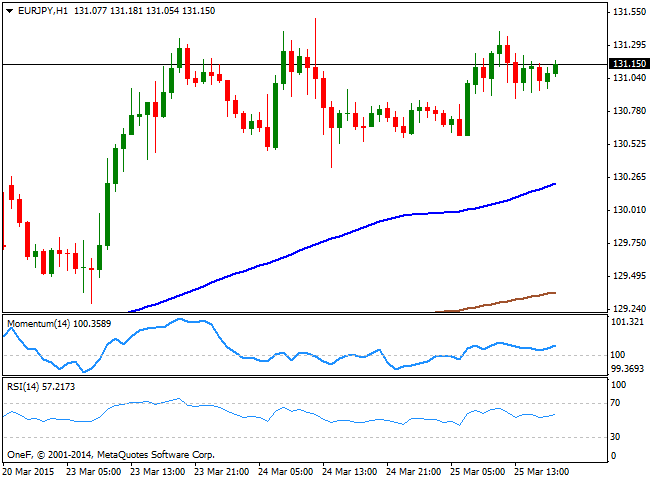
The EUR/JPY pair recovered above the 131.00 mark on the back of renewed EUR demand, but traded within a tight range for most of the last 24 hours. The short term technical picture favors the upside, as the 1 hour chart shows that the price develops below its 100 and 200 SMAs, both well below the current level, whilst the technical indicators aim slightly higher above their mid-lines. In the 4 hours chart, the price held above its 100 SMA, although the Momentum indicator has turned sharply lower above its mid-line, whilst the RSI aims higher around 62, limiting the upside at the time being. The price needs to break above the 131.50 area, where it has several intraday highs and lows, to be able to extend its gains further in the short term.
Support levels: 130.80 130.30 129.90
Resistance levels: 131.50 131.85 132.30
GBP/USD Current price: 1.4879
View Live Chart for the GBP/USD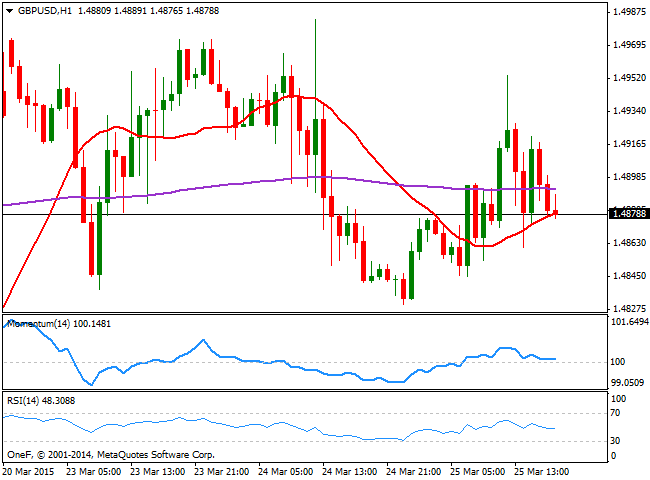
The GBP/USD enjoyed some limited demand early in the US session following the release of weak US data, surging up to 1.4953 before turning back lower. There have been no relevant news in the UK, except by Mortgage Approvals that rose above expected in February, a 5-month high. The rise has been however, moderated, and therefore not enough to spur concerns over a housing bubble. The UK will release its Retail Sales figures for February this Thursday, expected to have increased by 0.4% monthly basis, something that may give some support to the British Pound. In the meantime, the short term technical picture presents a neutral-to-bearish stance, as in the 1 hour chart, the price is aiming to break below its 20 SMA, whilst the technical indicators aim lower around their mid-lines. In the 4 hours chart however, the outlook is bearish, as the price was unable to establish above its 20 SMA, while the Momentum indicator crossed its 100 level to the downside. The 1.4830 is now the immediate support, with a break below it favoring some additional declines towards the 1.4760/70 price zone.
Support levels: 1.4830 1.4800 1.4765
Resistance levels: 1.4920 1.4950 1.5000
USD/JPY Current price: 119.63
View Live Chart for the USD/JPY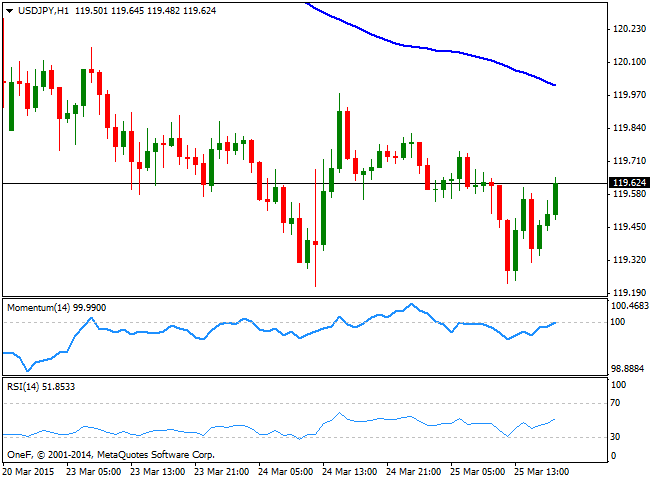
The Japanese yen saw some intraday demand that drove the USD/JPY to the base of its latest range around 119.20, from where the pair bounced back up to current level. Buying interest around the mentioned low is quite strong, as the pair managed to recover, despite the overall negative stance of stocks in the American afternoon. Technically, the 1 hour chart shows that the technical indicators are aiming higher and about to cross their mid-lines, anticipating some further intraday gains, although the price stands well below its moving averages, with the 100 SMA, offering now dynamic resistance around 120.00. In the 4 hours chart, the technical indicators are also heading higher, but remain still below their mid-lines, supporting the shorter term view. Sellers have been containing the upside around the 120.00 figure, which means some follow through beyond the level is required to confirm a steadier advance.
Support levels: 119.20 118.80 118.50
Resistance levels: 120.00 120.35 120.80
AUD/USD Current price: 0.7838
View Live Chart for the AUD/USD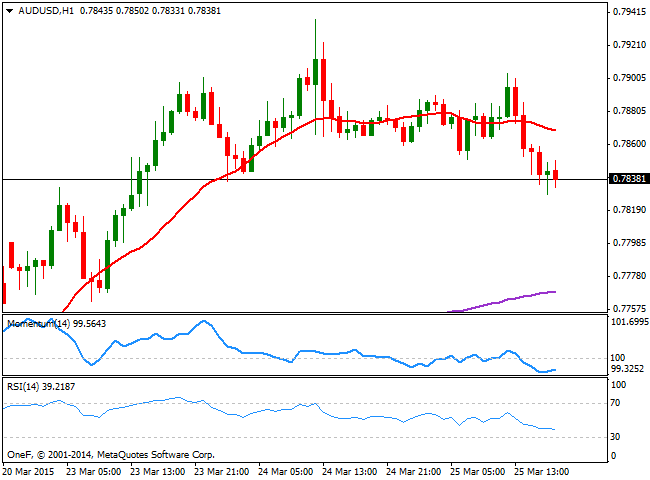
The Australian dollar lost its latest charm, easing against the greenback to a 2-day low of 0.7828, consolidating by the end of the day a few pips above the level. There will be no relevant data in Australia during the upcoming Asian session, which means the pair may continue following technical studies during the upcoming hours. Short term, the 1 hour chart shows an increased bearish potential as the price stands below a bearish 20 SMA and the technical indicators heading lower in negative territory. In the 4 hours chart the price is breaking below a bullish 20 SMA, whilst the technical indicators present strong bearish slopes near their mid-lines, about to signal additional declines. A downward continuation below the 0.7790 support should see the pair accelerating lower, eyeing as next short term target, the 0.7750 price zone.
Support levels: 0.7815 0.7790 0.7750
Resistance levels: 0.7860 0.7900 0.7940
Recommended Content
Editors’ Picks
EUR/USD holds below 1.0750 ahead of key US data

EUR/USD trades in a tight range below 1.0750 in the European session on Friday. The US Dollar struggles to gather strength ahead of key PCE Price Index data, the Fed's preferred gauge of inflation, and helps the pair hold its ground.
USD/JPY stays firm above 156.00 after BoJ Governor Ueda's comments

USD/JPY stays firm above 156.00 after surging above this level on the Bank of Japan's decision to leave the policy settings unchanged. BoJ Governor said weak Yen was not impacting prices but added that they will watch FX developments closely.
Gold price oscillates in a range as the focus remains glued to the US PCE Price Index

Gold price struggles to attract any meaningful buyers amid the emergence of fresh USD buying. Bets that the Fed will keep rates higher for longer amid sticky inflation help revive the USD demand.
Bitcoin Weekly Forecast: BTC’s next breakout could propel it to $80,000 Premium

Bitcoin’s recent price consolidation could be nearing its end as technical indicators and on-chain metrics suggest a potential upward breakout. However, this move would not be straightforward and could punish impatient investors.
US core PCE inflation set to signal firm price pressures as markets delay Federal Reserve rate cut bets

The core PCE Price Index, which excludes volatile food and energy prices, is seen as the more influential measure of inflation in terms of Fed positioning. The index is forecast to rise 0.3% on a monthly basis in March, matching February’s increase.