EUR/USD Current price: 1.2219
View Live Chart for the EUR/USD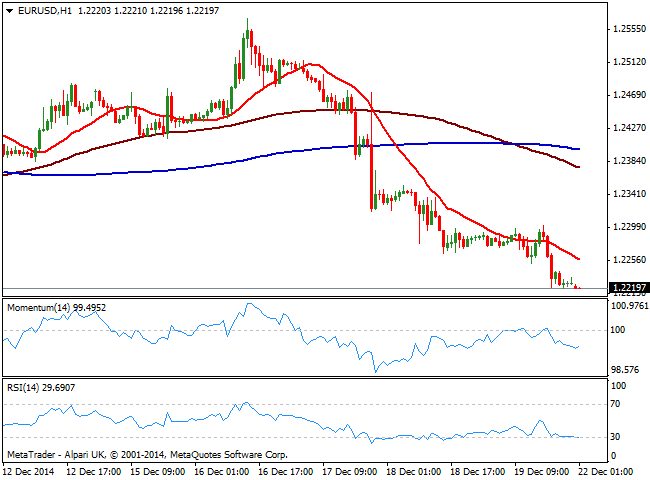
Thin holiday markets had kick started last Friday but not before the EUR/USD pair extended its decline to a new low for the year at 1.2219. Dollar strengthened across the board into the year end, following FED’s decision to drop the pledge to keep borrowing costs near zero for a “considerable time.” The pace of tightening may be slower that what markets has been anticipating, as Mrs. Yellen delayed the decision “for at least the next couple of meetings,” but it will indeed anticipate any other major economy move towards tightening in at least a year. For the upcoming days, the markets are expected to have no volume whilst volatility may see some short lived spikes before majors turn back into tight ranges.
When it comes to the technical picture, the EUR/USD pair trades at levels not seen since August 2012, biased lower according to the 1 hour chart that shows that the price is developing below a bearish 20 SMA while 100 SMA crossed below 200 SMA, both well above current price. Indicators in the same time frame indicators are heading lower near oversold levels, while in the 4 hours chart the 20 SMA turned strongly down above current price as indicators maintain their bearish slope despite in oversold levels, all of which supports further declines.
Support levels: 1.2080 1.2035 1.1990
Resistance levels: 1.2150 1.2190 1.2240
EUR/JPY Current price: 146.10
View Live Chart for the EUR/JPY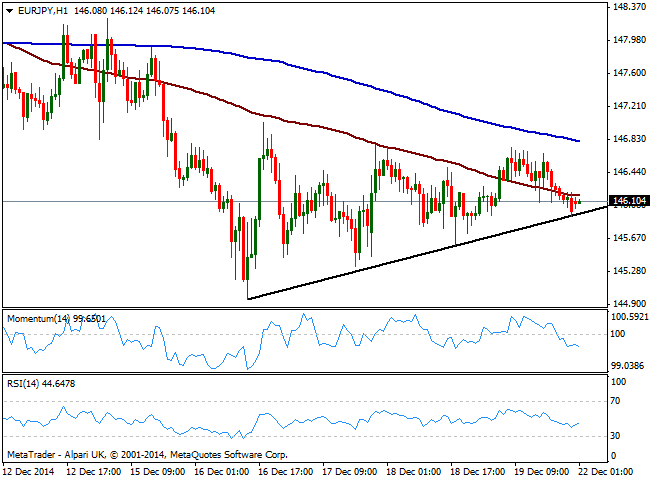
The EUR/JPY cross trades lower in range, pressuring a short term ascendant trend line a few pips below the current price. The EUR self weakness keeps the pair under pressure despite Yen is in no better shape against its European rival. Short term the 1 hour chart shows price developing below its 100 SMA that maintains a bearish slope a few pips above the current level, as momentum heads lower below 100, supporting further declines. In the 4 hours chart the technical picture is more neutral, with indicators hovering around their midlines albeit the downside is favored, with a break below 145.90 exposing the 145.00 level during the upcoming hours.
Support levels: 145.90 145.55 145.00
Resistance levels: 146.40 146.90 147.30
GBP/USD Current price: 1.5622
View Live Chart for the GBP/USD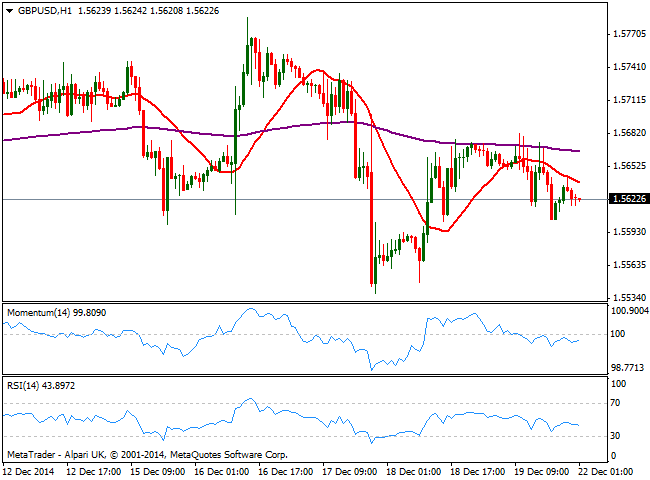
The British Pound has held fairly steady against its American rival, with the GBP/USD pair confined to a tight 300 pips for most of the last two month. Nevertheless the dollar advanced around 1300 pips against its European rival during this 2014 in a steady 1700 pips decline after toping at 1.7190 last July. A few days before that spike, BOE’s Governor Mark Carney diminished chances of a rate hike in the UK, by expressing his concerns over wages. Ever since then, it has been a one way ride for the GBP/USD, albeit the 1.5500 level is still refusing to give up. Short term the 1 hour chart shows that the price is being capped by a bearish 20 SMA, while indicators aim slightly lower below their midlines. In the 4 hours chart the price also stands below a bearish 20 SMA albeit indicators diverge from each other in negative territory, showing no clear directional bias at the time being. The 1.5610/20 area has prove its strength as intraday support, so a downward acceleration through the area should lead to some continued decline this Monday, whilst buyers may likely surge if the pair advances towards the 1.5700 figure.
Support levels: 1.5615 1.5590 1.5540
Resistance levels: 1.5665 1.5700 1.5735
USD/JPY Current price: 119.56
View Live Chart for the USD/JPY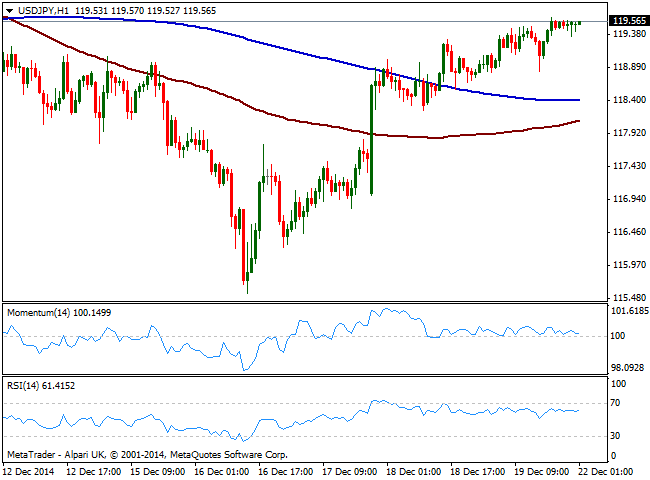
The USD/JPY kept advancing alongside with stocks, reaching a weekly high of 119.62 last Friday and even gapping higher in early interbank trading this Sunday. The downward move seen starting during the second week of December that extended as low as 115.55 has proved to be corrective, some profit taking for the books, as the pair is positioned to recover back above the 120.00 level. Short term, the 1 hour chart shows price extended above its moving averages but remained confined to a tight range, as indicators lose momentum and turn lower right above their midlines. In the 4 hours chart the 100 SMA is above the 200 SMA, both below current price, with the shortest providing immediate short term support at 118.90 while indicators aim slightly lower above their midlines, losing their upward strength.
Support levels: 119.30 118.90 118.50
Resistance levels: 119.65 120.00 120.45
AUD/USD Current price: 0.8145
View Live Chart of the AUD/USD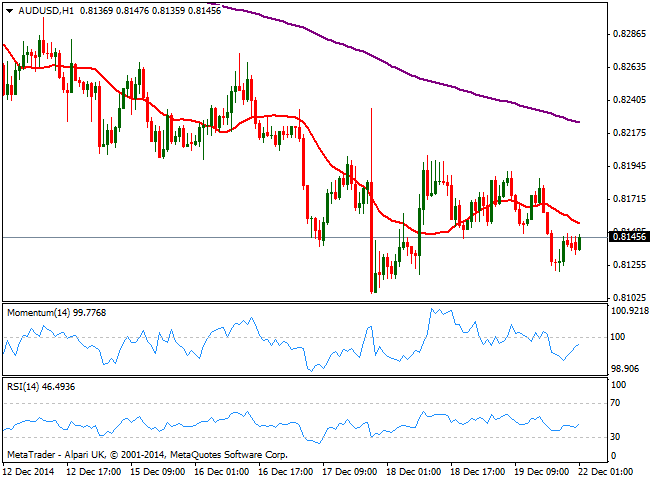
The AUD/USD pair opens slightly higher after posting a multiyear low of 0.8106 last Wednesday. The downtrend however is firm in place, with the Aussie among the weakest currencies of the board, following EUR and JPY. The Australian currency has tumbled early December on worse than expected GDP readings in the third quarter, accelerating its decline. Furthermore, RBA Governor Stevens’ pledge for an AUD/USD at 0.7500 has fueled the slide. Short term the 1 hour chart shows that the price stands below its 20 SMA, whilst indicators aim higher but hold in negative territory still. In the 4 hours chart the price has been unable to overcome a strongly bearish 20 SMA that offers now immediate short term resistance around 0.8170, while momentum turned lower below 100.
Support levels: 0.8105 0.8060 0.8025
Resistance levels: 0.8170 0.8200 0.8240
Recommended Content
Editors’ Picks

EUR/USD consolidates weekly gains above 1.1150
EUR/USD moves up and down in a narrow channel slightly above 1.1150 on Friday. In the absence of high-tier macroeconomic data releases, comments from central bank officials and the risk mood could drive the pair's action heading into the weekend.

GBP/USD stabilizes near 1.3300, looks to post strong weekly gains
GBP/USD trades modestly higher on the day near 1.3300, supported by the upbeat UK Retail Sales data for August. The pair remains on track to end the week, which featured Fed and BoE policy decisions, with strong gains.

Gold extends rally to new record-high above $2,610
Gold (XAU/USD) preserves its bullish momentum and trades at a new all-time high above $2,610 on Friday. Heightened expectations that global central banks will follow the Fed in easing policy and slashing rates lift XAU/USD.

Week ahead – SNB to cut again, RBA to stand pat, PCE inflation also on tap
SNB is expected to ease for third time; might cut by 50bps. RBA to hold rates but could turn less hawkish as CPI falls. After inaugural Fed cut, attention turns to PCE inflation.

Bank of Japan set to keep rates on hold after July’s hike shocked markets
The Bank of Japan is expected to keep its short-term interest rate target between 0.15% and 0.25% on Friday, following the conclusion of its two-day monetary policy review. The decision is set to be announced during the early Asian session.

Moneta Markets review 2024: All you need to know
VERIFIED In this review, the FXStreet team provides an independent and thorough analysis based on direct testing and real experiences with Moneta Markets – an excellent broker for novice to intermediate forex traders who want to broaden their knowledge base.