EUR/USD Current price: 1.3352
View Live Chart for the EUR/USD
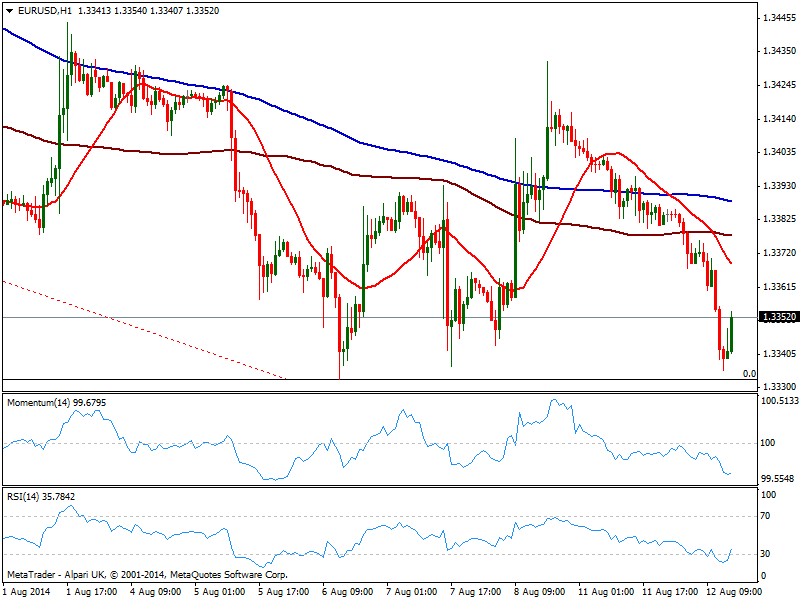
The EUR/USD was hit by German news, down to 1.3335 on comments local GDP may disappoint next Thursday, while ZEW survey show a strong set back in economic confidence. Technically, the hourly chart shows price well below its moving averages, with 20 SMA presenting a strong bearish slope and crossing below 100 and 200 ones, which supports the dominant bearish trend, albeit indicators bounce from oversold readings, supporting current upward corrective movement, that may extend up to 1.3400 without really affecting that trend. In the 4 hours chart indicators are biased lower, yet lacking clear bearish momentum at the time being, probably due to the lack of volume over these last few days. With market for the most short in the pair, the break lower may produce shallow results, yet 1.3295 continues to be the immediate bearish target once 1.3330 gives up.
Support levels: 1.3330 1.3295 1.3250
Resistance levels: 1.3370 1.3410 1.3450
GBP/USD Current price: 1.6782
View Live Chart for the GBP/USD
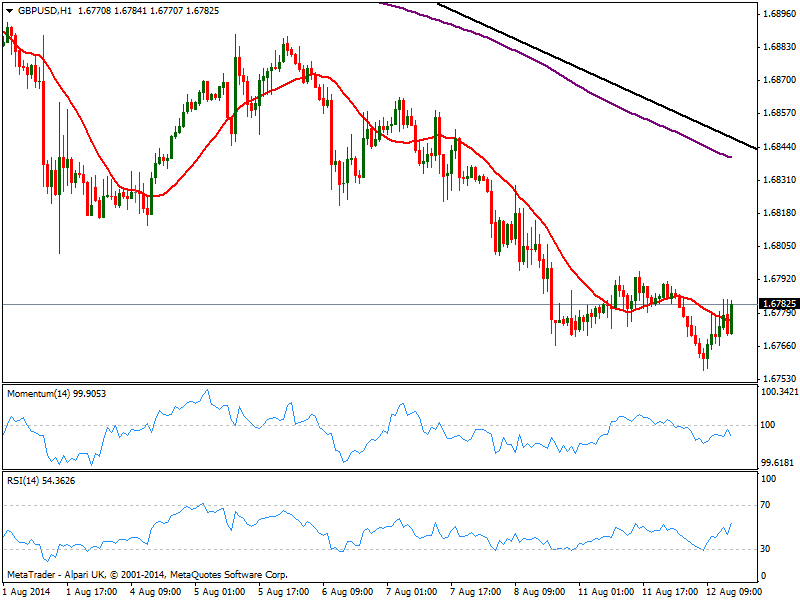
The GBP/USD trades around its daily opening after extending is decline to a fresh monthly low of 1.6756 early Europe. Technically however, there’s little directional strength at the time being, with market players probably waiting for Wednesday data on employment and inflation in the UK before taking their chances. The hourly chart shows indicators in neutral territory, as price struggles around a flat 20 SMA, while the 4 hours chart shows indicators bouncing from oversold levels, and 20 SMA offering dynamic resistance around the 1.6800 figure. Above this last, a daily descendant trend line coming from this year high stands as ultimate resistance around 1.6840, and seems unlikely price will break above it until mentioned news are out.
Support levels: 1.6770 1.6730 1.6695
Resistance levels: 1.6800 1.6840 1.6885
USD/JPY Current price: 102.18
View Live Chart for the USD/JPY
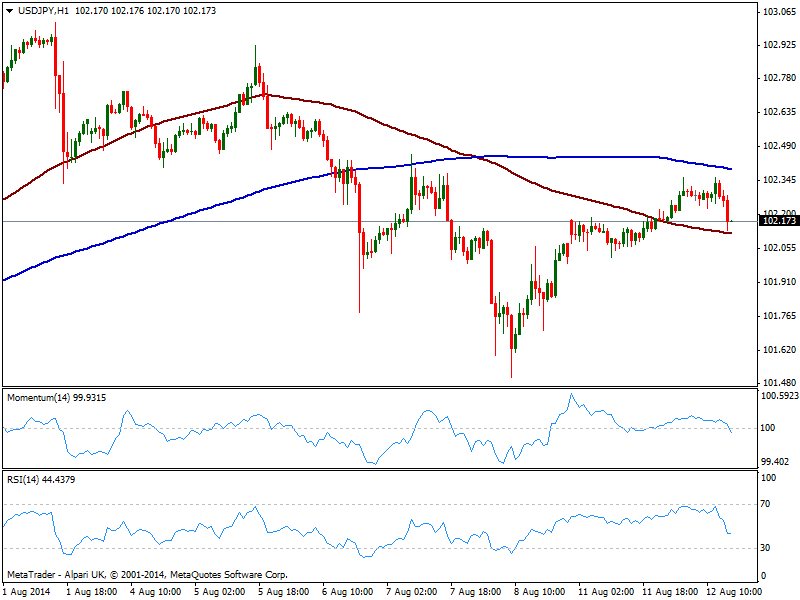
The USD/JPY extended up to 102.36 on the day, retracing now from the strong static resistance area. The hourly chart shows indicators crossing their midlines to the downside, which suggest some further slides ahead, albeit price holds above its 100 SMA limiting the ability of the pair to extend its decline at the time being. In the 4 hours chart indicators are biased higher, yet only a clear break above 102.30/40 price zone, will favor an advance up to 102.80 price zone.
Support levels: 101.95 101.60 101.20
Resistance levels: 102.35 102.80 103.10
AUD/USD Current price: 0.9268
View Live Chart for the AUD/USD
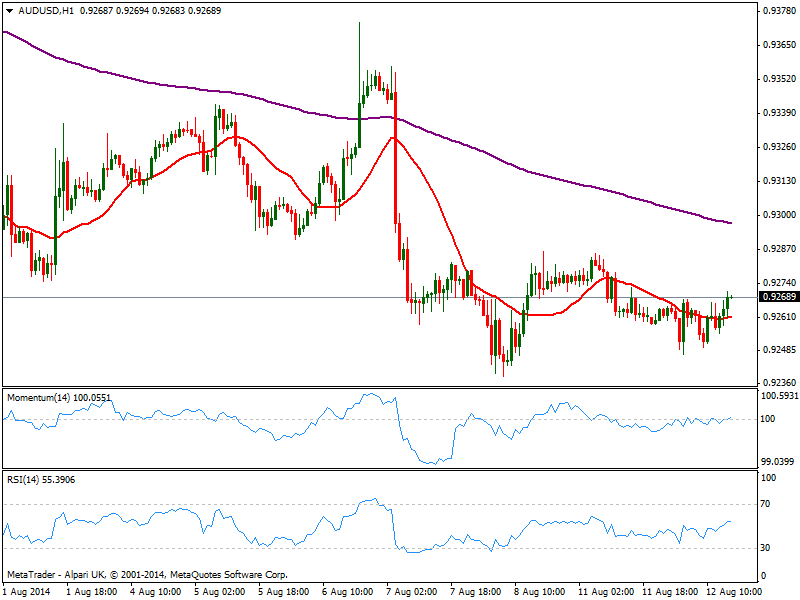
Aussie trades uneventfully around 0.9260 against the greenback, with the short term outlook still neutral for the pair: the hourly chart shows momentum flat around 100 and 20 SMA also horizontal. In the 4 hours chart a mild positive tone comes from technical readings, yet chances of strong moves are delay to upcoming Asian session, with data coming from Australia and China to hopefully bring some action to the pair.
Support levels: 0.9260 0.9220 0.9180
Resistance levels: 0.9290 0.9330 0.9370
Recommended Content
Editors’ Picks
EUR/USD holds above 1.0700 ahead of key US data

EUR/USD trades in a tight range above 1.0700 in the early European session on Friday. The US Dollar struggles to gather strength ahead of key PCE Price Index data, the Fed's preferred gauge of inflation, and helps the pair hold its ground.
USD/JPY stays above 156.00 after BoJ Governor Ueda's comments

USD/JPY holds above 156.00 after surging above this level with the initial reaction to the Bank of Japan's decision to leave the policy settings unchanged. BoJ Governor said weak Yen was not impacting prices but added that they will watch FX developments closely.
Gold price oscillates in a range as the focus remains glued to the US PCE Price Index

Gold price struggles to attract any meaningful buyers amid the emergence of fresh USD buying. Bets that the Fed will keep rates higher for longer amid sticky inflation help revive the USD demand.
Sei Price Prediction: SEI is in the zone of interest after a 10% leap

Sei price has been in recovery mode for almost ten days now, following a fall of almost 65% beginning in mid-March. While the SEI bulls continue to show strength, the uptrend could prove premature as massive bearish sentiment hovers above the altcoin’s price.
US core PCE inflation set to signal firm price pressures as markets delay Federal Reserve rate cut bets

The core PCE Price Index, which excludes volatile food and energy prices, is seen as the more influential measure of inflation in terms of Fed positioning. The index is forecast to rise 0.3% on a monthly basis in March, matching February’s increase.