EUR/USD Current price: 1.3380
View Live Chart for the EUR/USD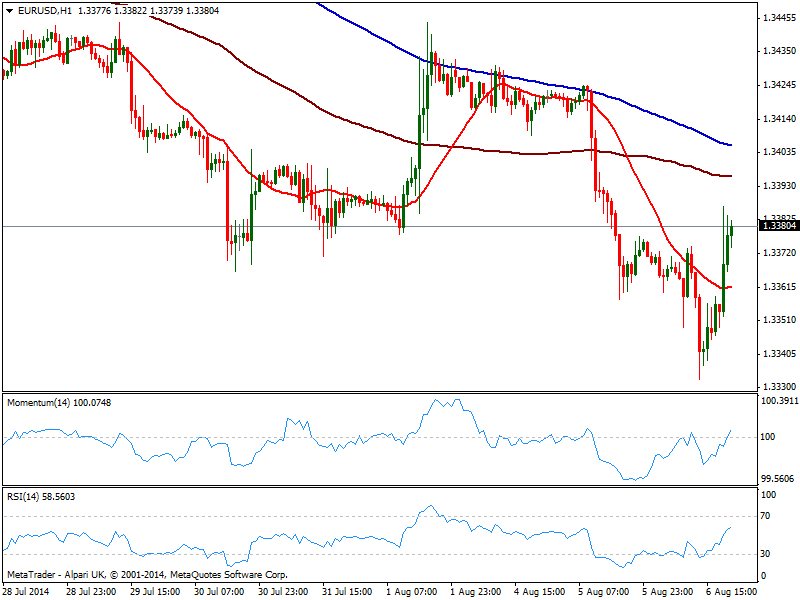
The EUR/USD started the day in the losing side, down to a fresh year low of 1.3332, with the usual suspects behind it weak European data, US improved one with a shrinking deficit, and stocks in red on risk aversion. US opening however, saw local share markets shrugging off fears and erasing early losses, now closing a handful points up. But the dollar sunk big out of the bloom mid American afternoon, movement that started with USD/JPY dipping to 101.78, in what seems to have been a really fat finger: market rumors talk about 27,000 contracts being place instead of 27. Despite unconfirmed, dollar maintained its weak footing particularly against the EUR that enters Asian session trading at its daily high.
Technically, the hourly chart shows a strong upward momentum coming from technical readings, with price above its 20 SMA but below 100 one, and indicators still heading north. In the 4 hours chart, indicators bounce from oversold readings, while 20 SMA stands around 1.3400 offering immediate short term resistance. Considering the ECB will meet early European session, the pair will likely trade range bound ahead of it, not seen overcoming 1.3440 before the news.
Support levels: 1.3335 1.3295 1.3250
Resistance levels: 1.3400 1.3440 1.3475
EUR/JPY Current price: 136.52
View Live Chart for the EUR/JPY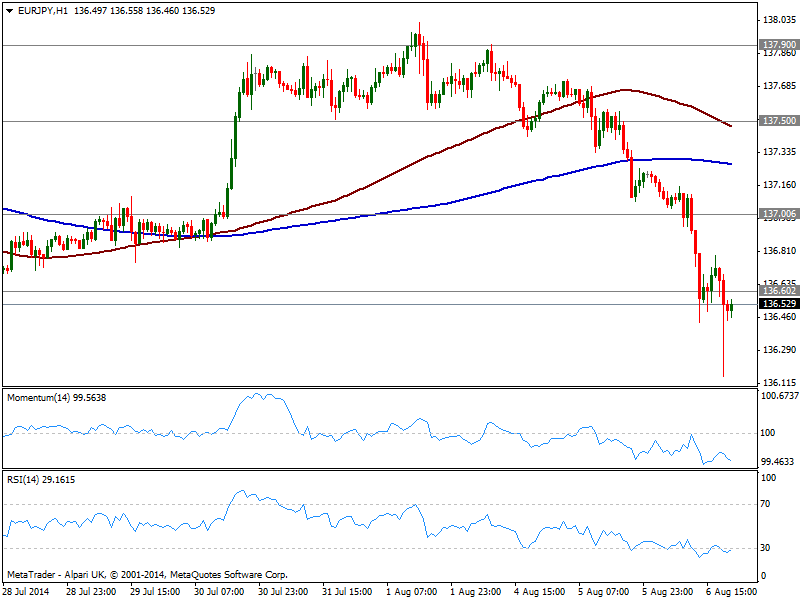
Yen wild intraday advance drove EUR/JPY to a fresh year low of 136.15, as the fat finger in yen contracts added to EUR self weakness. Slowly grinding higher, price consolidates below 136.60 strong static resistance level, with the hourly chat showing price well below 100 and 200 SMAs and momentum still heading lower despite in oversold levels. In the 4 hours chart indicators start getting exhausted in extreme oversold levels, but are far from suggesting an upward corrective movement. Above 136.60, the correction can extend near 137.00, but failure to advance beyond may see the pair resuming its slide after ECB.
Support levels: 136.60 136.20 135.80
Resistance levels: 136.90 137.50 137.90
GBP/USD Current price: 1.6844
View Live Chart for the GBP/USD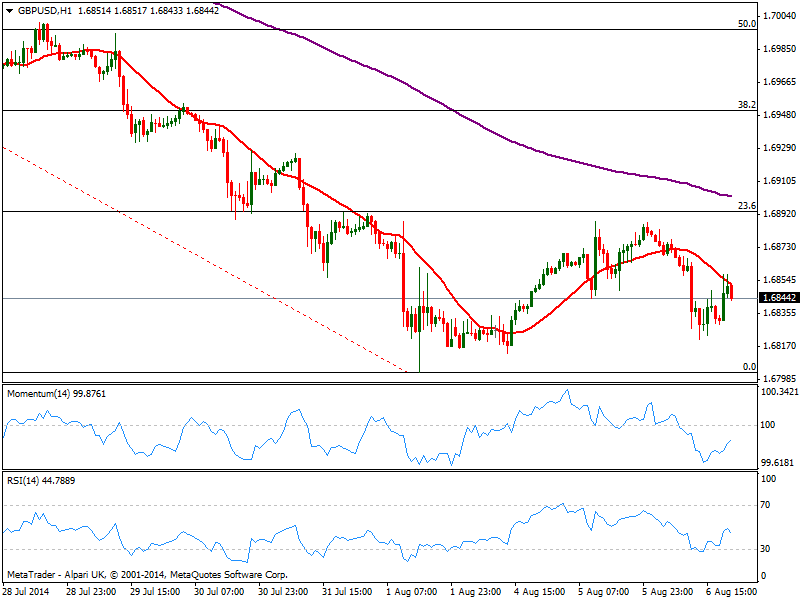
The GBP/USD continues to be restricted to a tight range, lower as per weighted by another round of weak UK data, this time in the form of manufacturing and industrial production. The pair posted then a daily low of 1.6821, albeit managed to bounce some up to current levels. The hourly chart shows 20 SMA capping the upside a few pips above current price, with momentum heading higher still below its midline, but RSI turning lower also in negative territory, which keeps the short term risk to the downside. In the 4 hours chart technical readings stand flat in neutral territory, lacking clear direction as per having traded in range for already a week. Despite the BOE will meet on Thursday, expectations are of a no change there, and therefore to have little influence in Pound.
Support levels: 1.6800 1.6770 1.6730
Resistance levels: 1.6845 1.6895 1.6940
USD/JPY Current price: 102.03
View Live Chart for the USD/JPY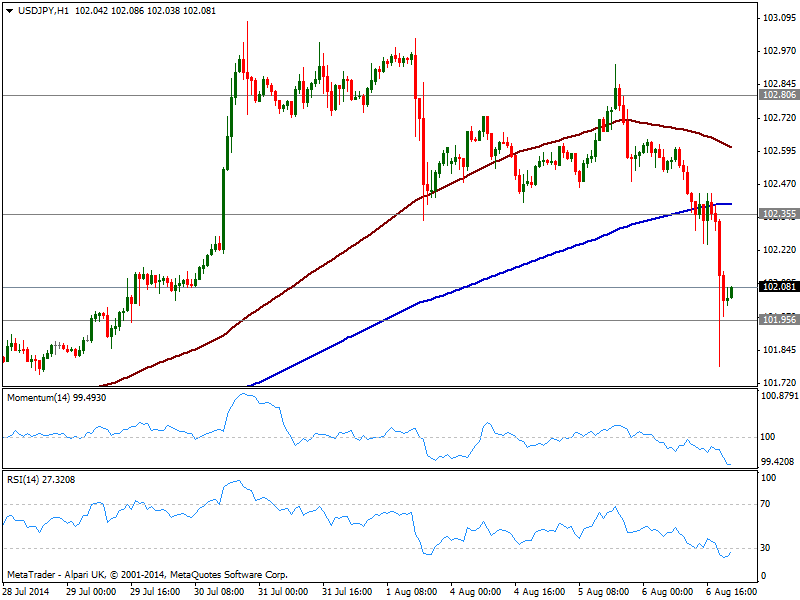
The USD/JPY recovered right above 102.00 following a daily low of 101.78, and with the hourly chart showing 100 and 200 SMAs well above current price, while indicators attempt a recovery still deep in oversold levels. In the 4 hours chart a strong downward momentum prevails in indicators, and sellers may surge near 102.35 former support area. In that case, further slides, down to 101.60 are possible moreover on risk aversion, and despite dollar potential to advance.
Support levels: 102.25 101.95 101.60
Resistance levels: 102.80 103.10 103.40
AUD/USD Current price: 0.9351
View Live Chart for the AUD/USD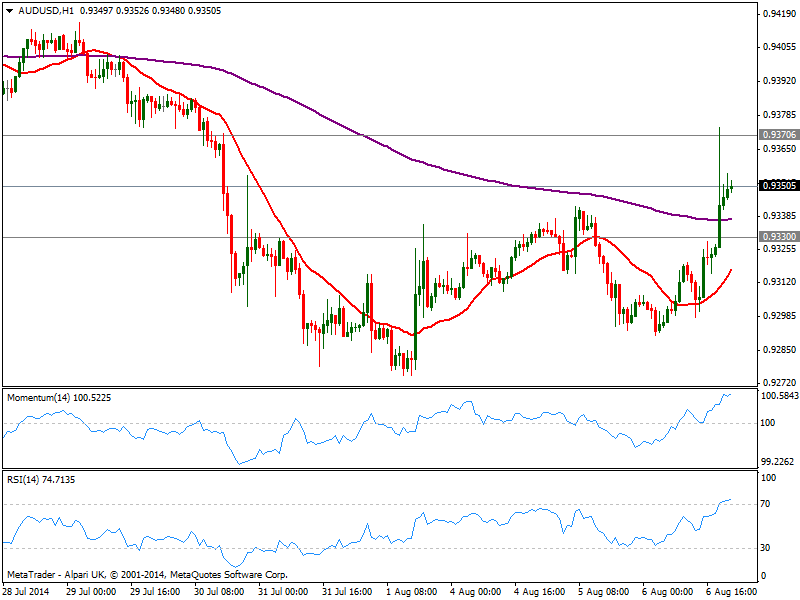
Commodity currencies were on demand this Thursday, backed by soaring gold, with the AUD/USD up to 0.9330 strong static resistance. The sudden dollar drop drove the pair up to next strong resistance area of 0.9370, from where the pair eased some but held above critical 0.9330. Ahead of Australian employment figures, the pair presents a strong upward momentum in the short term, with price well above a bullish 20 SMA and indicators heading strongly up despite in overbought levels. In the 4 hours chart the technical picture is also bullish, looking for a break above mentioned 0.9370 for an upward rally towards 0.9420, and bulls losing ground on a break below 0.9330.
Support levels: 0.9330 0.9300 0.9260
Resistance levels: 0.9370 0.9420 0.9460
Recommended Content
Editors’ Picks
EUR/USD holds above 1.0700 ahead of key US data

EUR/USD trades in a tight range above 1.0700 in the early European session on Friday. The US Dollar struggles to gather strength ahead of key PCE Price Index data, the Fed's preferred gauge of inflation, and helps the pair hold its ground.
USD/JPY stays above 156.00 after BoJ Governor Ueda's comments

USD/JPY holds above 156.00 after surging above this level with the initial reaction to the Bank of Japan's decision to leave the policy settings unchanged. BoJ Governor said weak Yen was not impacting prices but added that they will watch FX developments closely.
Gold price oscillates in a range as the focus remains glued to the US PCE Price Index

Gold price struggles to attract any meaningful buyers amid the emergence of fresh USD buying. Bets that the Fed will keep rates higher for longer amid sticky inflation help revive the USD demand.
Sei Price Prediction: SEI is in the zone of interest after a 10% leap

Sei price has been in recovery mode for almost ten days now, following a fall of almost 65% beginning in mid-March. While the SEI bulls continue to show strength, the uptrend could prove premature as massive bearish sentiment hovers above the altcoin’s price.
US core PCE inflation set to signal firm price pressures as markets delay Federal Reserve rate cut bets

The core PCE Price Index, which excludes volatile food and energy prices, is seen as the more influential measure of inflation in terms of Fed positioning. The index is forecast to rise 0.3% on a monthly basis in March, matching February’s increase.