EUR/USD Current Price: 1.1377
View Live Chart for the EUR/USD
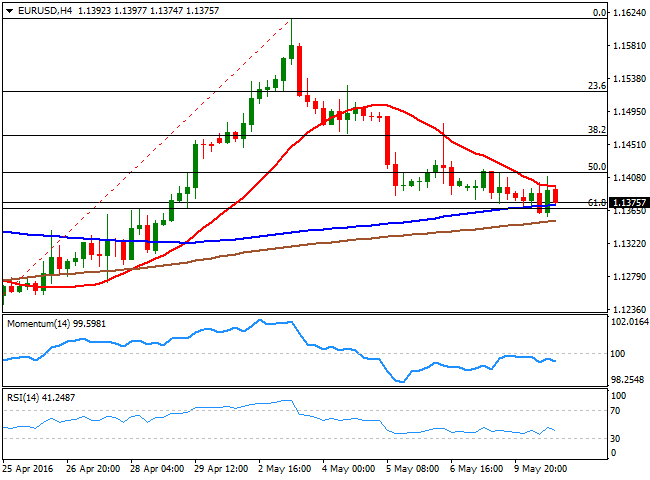
The EUR/USD pair traded uneventfully for a second consecutive day, ending the day pretty much flat around the 1.1380 region, although it fell intraday down to 1.1358, a fresh weekly low. With no major macroeconomic data having been released ever since the week started, speculative interest struggles to find a new direction for the pair, after it topped at 1.1615, a fresh yearly high, and completed a 50% downward correction.
Germany released disappointing Industrial Production data for Match, up year-on-year by 0.3%, against expectation of a 1.0% advance, while monthly basis it declined by 1.3%. The country's trade balance for the same month, however, posted a larger than expected surplus of €23.6B. In the US, more good news kept coming from the labor sector, as the JOLTS job opening report showed that the number of job openings increased to 5.757 million in March from a revised 5.608 million in February. Also, wholesale inventories in the US held at 0.1% in March, whilst sales rose 0.7%, the biggest monthly increase since April 2015.
From a technical point of view, the pair is on a brink of a downward breakout, barely holding around the 61.8% retracement of its latest daily bullish run at 1.1370. In the 4 hours chart early attempts of advancing were contained by a bearish 20 SMA, whilst the technical indicators head modestly lower below their mid-lines, lacking momentum amid the intraday restricted range. Nevertheless and as long as the price remains unable to recover above 1.1420, the risk is towards the downside, with scope to test the 1.1280/1.1300 price zone.
Support levels: 1.1335 1.1290 1.1250
Resistance levels: 1.1420 1.1460 1.1500
EUR/JPY Current price: 124.39
View Live Chart for the EUR/JPY
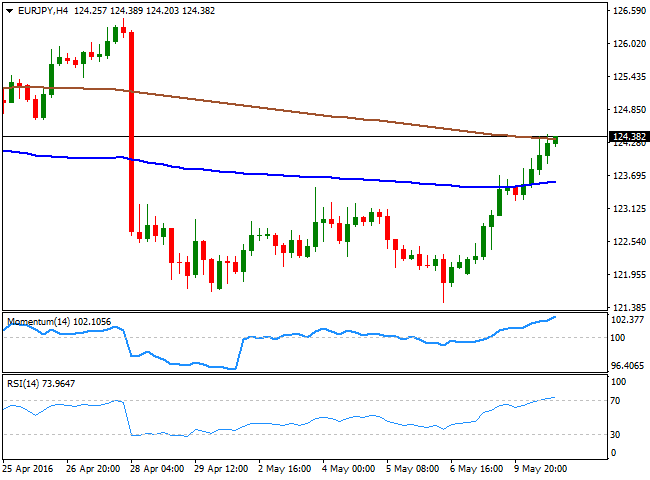
The EUR/JPY pair rallied on the back of JPY weakness, as a sharp recovery in Asian and European equities, kept the Japanese currency on the selling side ever since the day started. The JPY was weighed by fresh comments from the Finance Minister Taro Aso, who, speaking before the parliament said that “Japan will obviously intervene if one-sided moves persist.” The upward momentum in worldwide share markets did the rest. Now trading around a major resistance, the 124.40 price zone, the pair looks overstretched in the short term, but retains its bullish tone, as in the 1 hour chart, the 100 SMA crossed above the 200 SMA far below the current level and for the first time since early this year, whilst the RSI indicator hovers around 71, with no aims to turning lower. In the 4 hours chart, the technical indicators present strong bullish slopes, despite being in overbought territory, whilst the price is pressuring the 200 SMA. An upward acceleration above the current 124.40 region can see the pair extending its rally up to 126.45, April 28th daily high.
Support levels: 122.90 122.50 122.15
Resistance levels: 123.70 124.10 124.40
GBP/USD Current price: 1.4427
View Live Chart for the GBP/USD
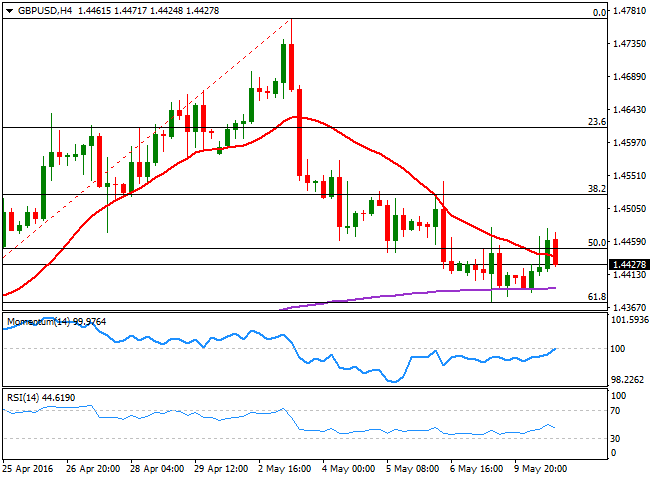
The GBP/USD pair traded within Monday's range, closing the day barely up, as a better-than-expected UK Trade balance for March, failed to spur demand for the depressed Pound ahead of BOE's Super Thursday, but prevent it from falling further. The kingdom's deficit shrank by 0.5B, resulting at 3.8B, also beating expectations. This Wednesday, the UK is expected to release its Manufacturing and Industrial Production figures for March, expected generally soft, but above February readings. The data, however, will hardly be enough to give the Pound a boost, as investors will likely remain side-lined ahead of the BOE's announcement. In the short term, the downside remains favored, as in the 1 hour chart, the price is barely holding above a bullish 20 SMA, while the technical indicators hold flat above their mid-lines, with no certain directional strength. In the 4 hours chart, the pair was unable to clearly recover above the 1.4445 level, the 50% retracement of its latest bullish run, whilst the RSI indicator has been rejected from its mid-line and the Momentum indicator holds around its 100 line, all of which indicates the risk remains towards the downside, particularly on a break below 1.4370, the 61.8% retracement of its latest bullish run.
Support levels: 1.4410 1.4375 1.4330
Resistance levels: 1.4445 1.4485 1.4520
USD/JPY Current price: 109.29
View Live Chart for the USD/JPY
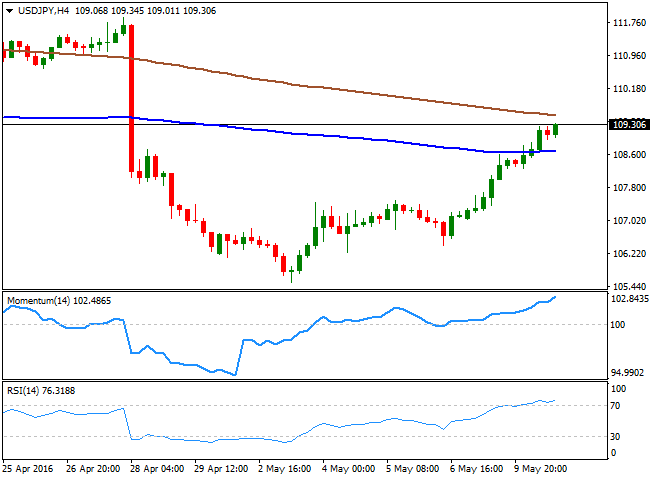
The USD/JPY pair ends the day at fresh 2-week highs in the 109.30 region, with the JPY under pressure due to an improved market sentiment that sent worldwide stocks higher. Also, more jawboning from BOJ's officers put the JPY under selling pressure at the beginning of the day, as the Finance Minister reiterated once again that it is ready to intervene should the one-sided moves in the yen persist. The pair has advanced around 200 pips ever since the day started with practically no downward corrections in the middle, leaving most of intraday technical indicators in overbought territory. In the 1 hour chart, the 100 SMA has crossed above the 200 SMA, both standing well below the current level, while the Momentum indicator diverges lower, posting lower lows as price advances, but within positive territory. In the same chart, the RSI indicator consolidates in overbought levels, with no aims of turning lower. In the 4 hours chart, the technical indicators maintain strong bullish slopes, despite being in extreme overbought levels, suggesting the rally may extend up to 110.60, a major static resistance level.
Support levels: 109.00 108.60 108.20
Resistance levels: 109.70 110.10 110.60
AUD/USD Current price: 0.7355
View Live Chart for the AUD/USD
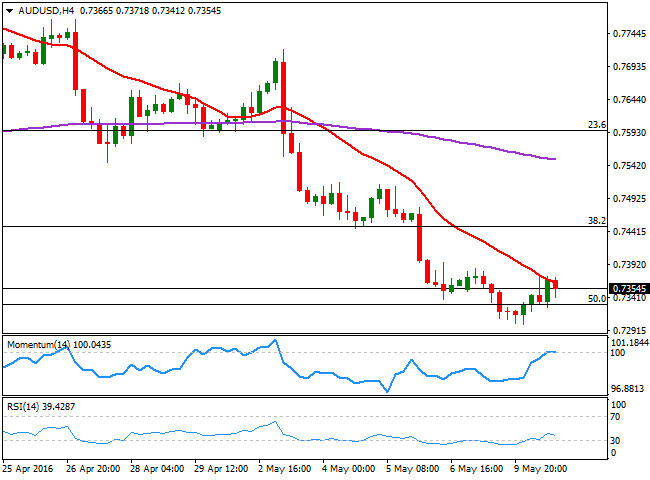
The AUD/USD pair bounced modestly from a fresh 2-month low of 0.7299 achieved during the Asian session, with the Aussie paring losses after reaching the 50% retracement of this year's rally. Stabilizing Chinese inflation and an intraday recovery in commodities, helped the pair to recover some ground, albeit the shallow advance is not enough to suggest the downward potential is over. Still Aussie weakness seems overextended ever since the RBA announced a surprise rate cut last week, and a sharp drop here is unlikely, before some consolidation/short term upward correction. From a technical point of view, the pair presents a very limited bullish tone as in the 1 hour chart, the price is above a bullish 20 SMA, but the technical indicators remain flat, right above their mid-lines. In the 4 hours chart, however, the risk remains towards the downside, as the price remains capped by a strongly bearish 20 SMA, whilst the technical indicators have stalled their advances around their mid-lines, with the RSI indicator already heading south around 39.
Support levels: 0.7290 0.7240 0.7200
Resistance levels: 0.7370 0.7410 0.7440
Information on these pages contains forward-looking statements that involve risks and uncertainties. Markets and instruments profiled on this page are for informational purposes only and should not in any way come across as a recommendation to buy or sell in these assets. You should do your own thorough research before making any investment decisions. FXStreet does not in any way guarantee that this information is free from mistakes, errors, or material misstatements. It also does not guarantee that this information is of a timely nature. Investing in Open Markets involves a great deal of risk, including the loss of all or a portion of your investment, as well as emotional distress. All risks, losses and costs associated with investing, including total loss of principal, are your responsibility. The views and opinions expressed in this article are those of the authors and do not necessarily reflect the official policy or position of FXStreet nor its advertisers. The author will not be held responsible for information that is found at the end of links posted on this page.
If not otherwise explicitly mentioned in the body of the article, at the time of writing, the author has no position in any stock mentioned in this article and no business relationship with any company mentioned. The author has not received compensation for writing this article, other than from FXStreet.
FXStreet and the author do not provide personalized recommendations. The author makes no representations as to the accuracy, completeness, or suitability of this information. FXStreet and the author will not be liable for any errors, omissions or any losses, injuries or damages arising from this information and its display or use. Errors and omissions excepted.
The author and FXStreet are not registered investment advisors and nothing in this article is intended to be investment advice.
Recommended Content
Editors’ Picks
EUR/USD trades with negative bias, holds above 1.0700 as traders await US PCE Price Index

EUR/USD edges lower during the Asian session on Friday and moves away from a two-week high, around the 1.0740 area touched the previous day. Spot prices trade around the 1.0725-1.0720 region and remain at the mercy of the US Dollar price dynamics ahead of the crucial US data.
USD/JPY jumps above 156.00 on BoJ's steady policy

USD/JPY has come under intense buying pressure, surging past 156.00 after the Bank of Japan kept the key rate unchanged but tweaked its policy statement. The BoJ maintained its fiscal year 2024 and 2025 core inflation forecasts, disappointing the Japanese Yen buyers.
Gold price flatlines as traders look to US PCE Price Index for some meaningful impetus

Gold price lacks any firm intraday direction and is influenced by a combination of diverging forces. The weaker US GDP print and a rise in US inflation benefit the metal amid subdued USD demand. Hawkish Fed expectations cap the upside as traders await the release of the US PCE Price Index.
Sei Price Prediction: SEI is in the zone of interest after a 10% leap

Sei price has been in recovery mode for almost ten days now, following a fall of almost 65% beginning in mid-March. While the SEI bulls continue to show strength, the uptrend could prove premature as massive bearish sentiment hovers above the altcoin’s price.
US economy: Slower growth with stronger inflation

The US Dollar strengthened, and stocks fell after statistical data from the US. The focus was on the preliminary estimate of GDP for the first quarter. Annualised quarterly growth came in at just 1.6%, down from the 2.5% and 3.4% previously forecast.