EUR/USD Current price: 1.3531
View Live Chart for the EUR/USD
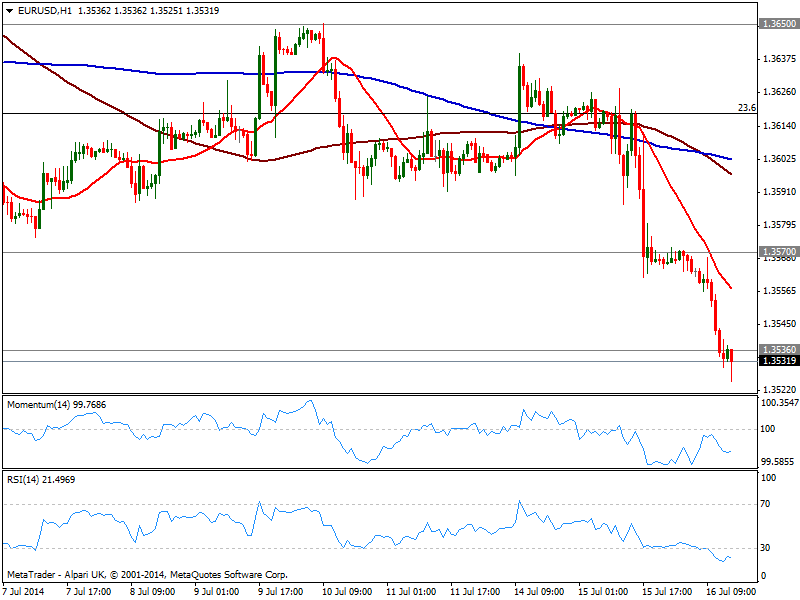
The EUR/USD trades at its lowest level in over a month, flirting around 1.3520 and extending the decline post Yellen’s first testimony. Due to continue speaking before the Senate today, market may have already absorbed most of what she has to say regarding upcoming economic policies, albeit more market reactions should not be disregarded just yet. With no other major catalysts for the EUR/USD today, the hourly chart shows a strong bearish tone, with moving averages well above current price and heading south, while indicators are biased lower below their midlines. In the 4 hours chart the bearish momentum is even stronger, pointing for a retest of June low of 1.3502, ahead of this year low of 1.3476. To the upside, 1.3570 has attracted intraday sellers so recovery up to that level will likely be seen as selling opportunities.
Support levels: 1.3500 1.3476 1.3440
Resistance levels: 1.3570 1.3620 1.3650
GBP/USD Current price: 1.7140
View Live Chart for the GBP/USD
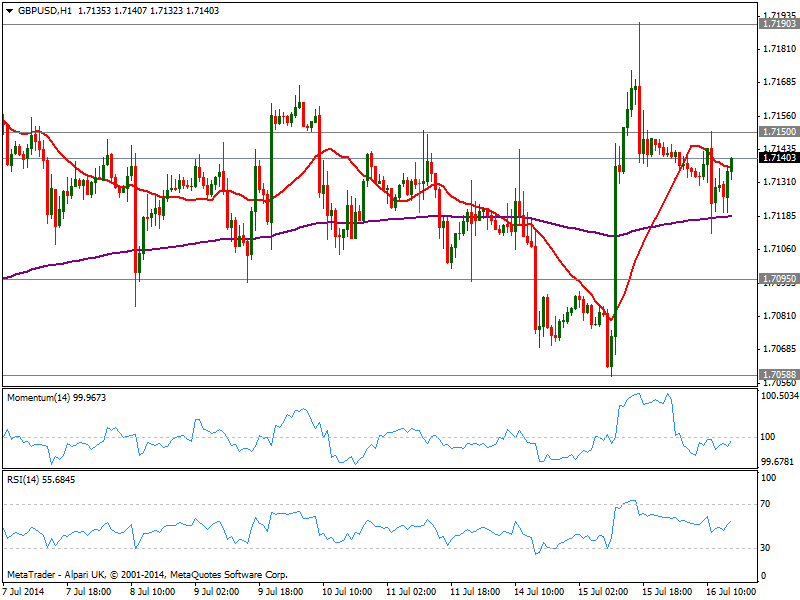
Pound eased to a daily low of 1.7112 against the greenback, on the back of weak wages within employment figures, but the pair trades in its latest range, with the hourly chart showing price trying to advance above its 20 SMA and indicators aiming higher and nearing their midlines. In the 4 hours chart price found support in a flat 20 SMA while indicators bounce some from their midlines, heading north but lacking strength. The upside remains favored, albeit a break above 1.7150 is required to confirm a new leg up.
Support levels: 1.7120 1.7095 1.7060
Resistance levels: 1.7150 1.7180 1.7220
USD/JPY Current price: 101.70
View Live Chart for the USD/JPY
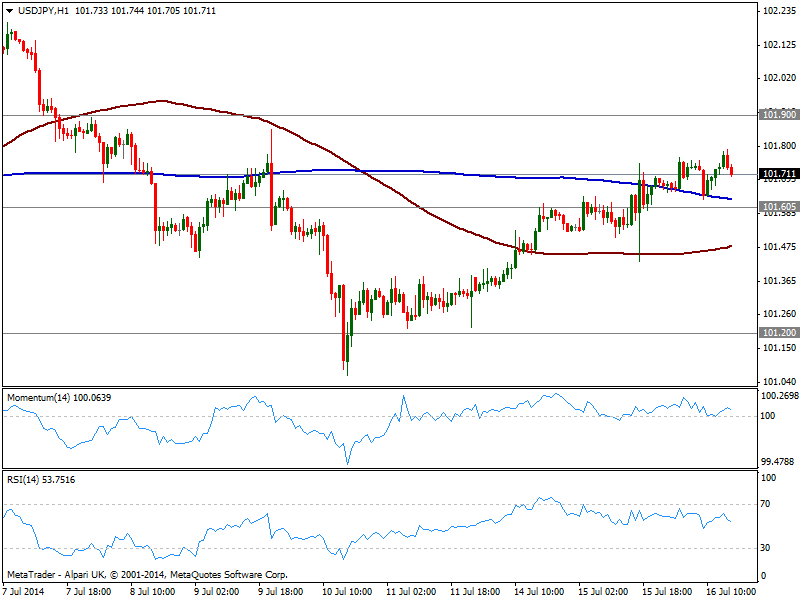
The USD/JPY added a few pips on the day as stocks regained the upside after yesterdays’ fear driven slide. Nevertheless the pair shows no upward momentum, and the hourly chart shows price easing towards 101.60 support, while indicators turned lower above their midlines. In the 4 hours chart technical readings also turned south in positive territory, not yet signaling a downward move: either a price acceleration above 101.95 or below 101.60 is required to confirm a more directional intraday move.
Support levels: 101.60 101.20 100.70
Resistance levels: 101.95 102.35 102.80
AUD/USD Current price: 0.9356
View Live Chart for the AUD/USD
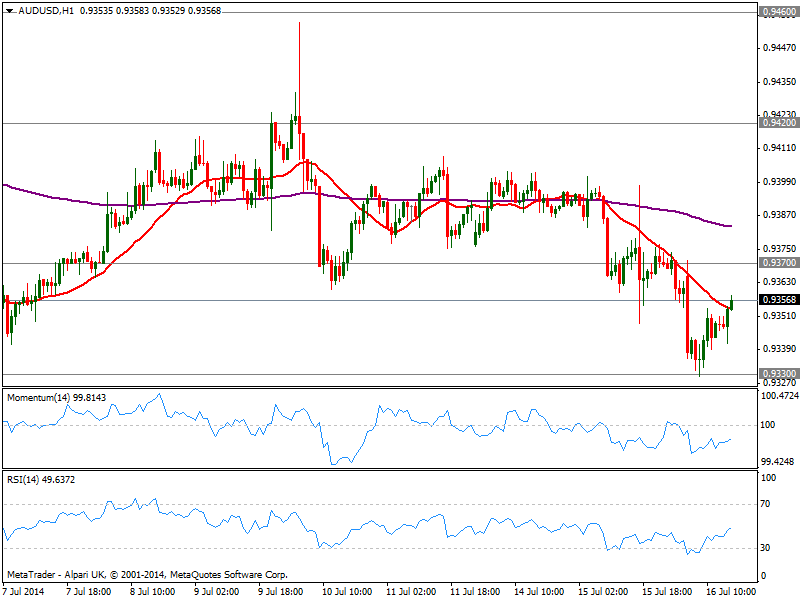
The AUD/USD tested 0.9330 strong static support during Asian hours, again founding buying interest in the key level. The hourly chart shows price above a still bearish 20 SMA, while indicators stand in negative territory, giving little support to this latest recovery. In the 4 hours chart a mild bearish tone prevails as per price below its 200 EMA and momentum heading south below its midlines.
Support levels: 0.9330 0.9300 0.9260
Resistance levels: 0.9370 0.9420 0.9460
Recommended Content
Editors’ Picks
EUR/USD holds above 1.0700 ahead of key US data

EUR/USD trades in a tight range above 1.0700 in the early European session on Friday. The US Dollar struggles to gather strength ahead of key PCE Price Index data, the Fed's preferred gauge of inflation, and helps the pair hold its ground.
USD/JPY stays above 156.00 after BoJ Governor Ueda's comments

USD/JPY holds above 156.00 after surging above this level with the initial reaction to the Bank of Japan's decision to leave the policy settings unchanged. BoJ Governor said weak Yen was not impacting prices but added that they will watch FX developments closely.
Gold price oscillates in a range as the focus remains glued to the US PCE Price Index

Gold price struggles to attract any meaningful buyers amid the emergence of fresh USD buying. Bets that the Fed will keep rates higher for longer amid sticky inflation help revive the USD demand.
Sei Price Prediction: SEI is in the zone of interest after a 10% leap

Sei price has been in recovery mode for almost ten days now, following a fall of almost 65% beginning in mid-March. While the SEI bulls continue to show strength, the uptrend could prove premature as massive bearish sentiment hovers above the altcoin’s price.
US core PCE inflation set to signal firm price pressures as markets delay Federal Reserve rate cut bets

The core PCE Price Index, which excludes volatile food and energy prices, is seen as the more influential measure of inflation in terms of Fed positioning. The index is forecast to rise 0.3% on a monthly basis in March, matching February’s increase.